
It looks like a crazy fact, but not all AI models cost a fortune like Claude or ChatGPT; some of them are free. While everyone is focused on ChatGPT, MoonshotAI published an open-source model.
You can use it for free on your browser, and the API usage is cheap. That’s why we will discover it through data analysis. It does not have multimodal capabilities yet, but it could not stop us! Let’s get started!
What is Kimi?
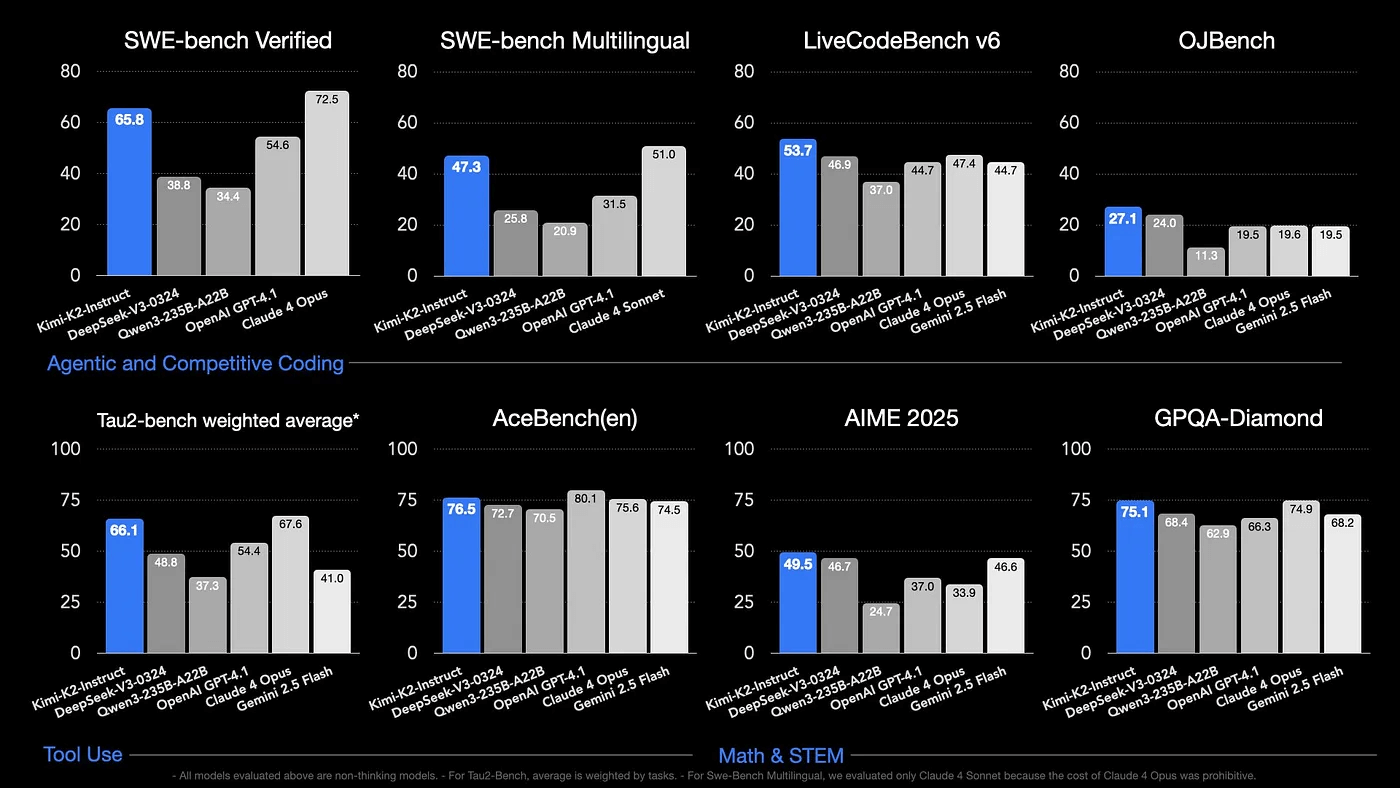
Kimi K2: Reference
Limi K2 was created by Moonshot AI. It’s one of the top open-source models for coding and agent tasks, and it is free, and the api usage is really cheap.
$0.15 / million input tokens (cache hit)
$0.60 / million input tokens (cache miss)
$2.50 / million output tokens
If you want to use the API, visit here. Now, let’s test it to see how we can leverage it while doing data analysis.
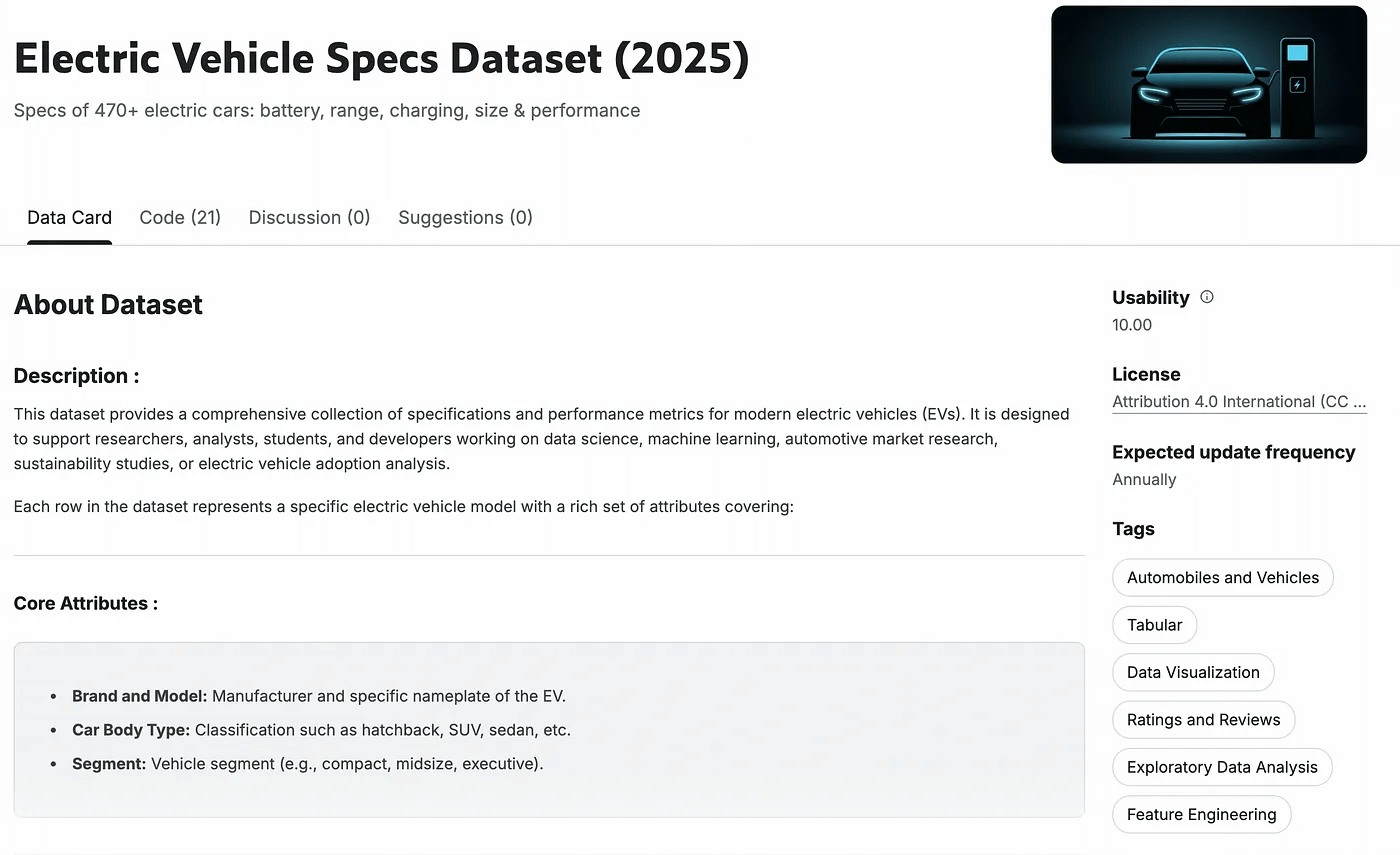
Electric Vehicle Specs Dataset (2025)
Here is the link to this dataset. [One-step explanation of the dataset]
Let’s download this dataset and see the head of it.
import pandas as pd
df = pd.read_csv("electric_vehicles_spec_2025.csv")
df.head()
Here is the head of it.
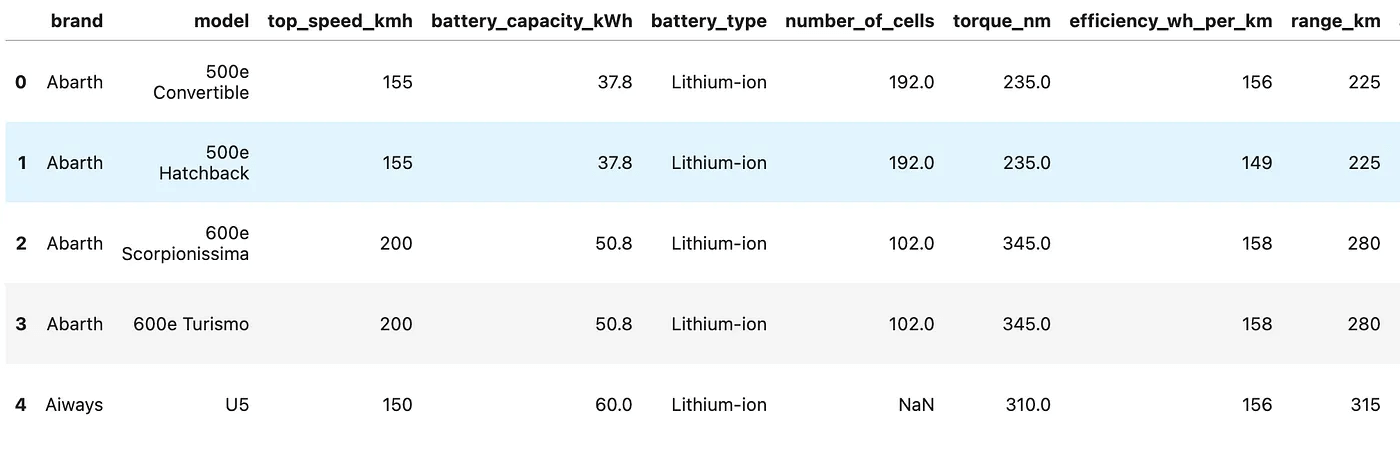
Head of Electric Vehicle Specs Dataset(2025)
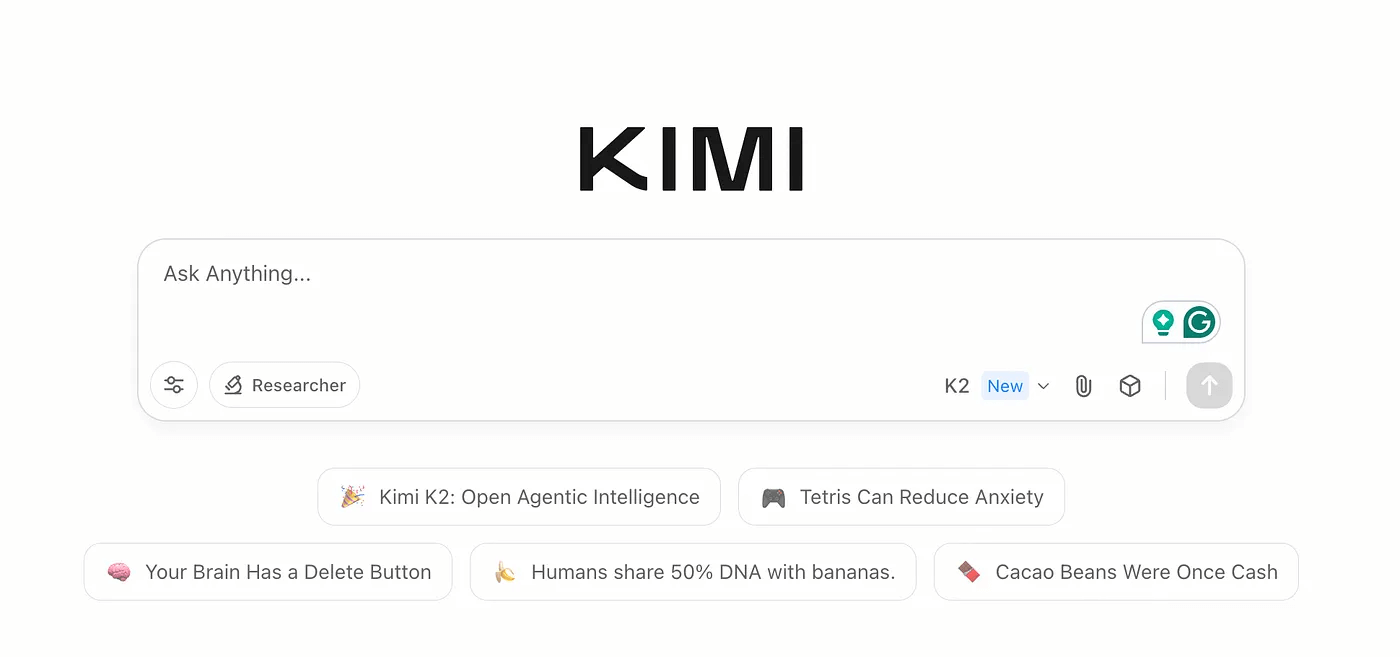
Kimi K2
Visit the site from here and sign up. The interface looks familiar, but the model doesn’t support images or media yet. (not multimodal)
Data Exploration
If we sent the dataset with a description copied from Kaggle, I believe we can leverage it. Let’s start. Here is the prompt we are going to use;
Here is the dataset description: []
The dataset is attached.
Use methods like info, head, tail, describe and more to explore this dataset.
Let’s see the output.
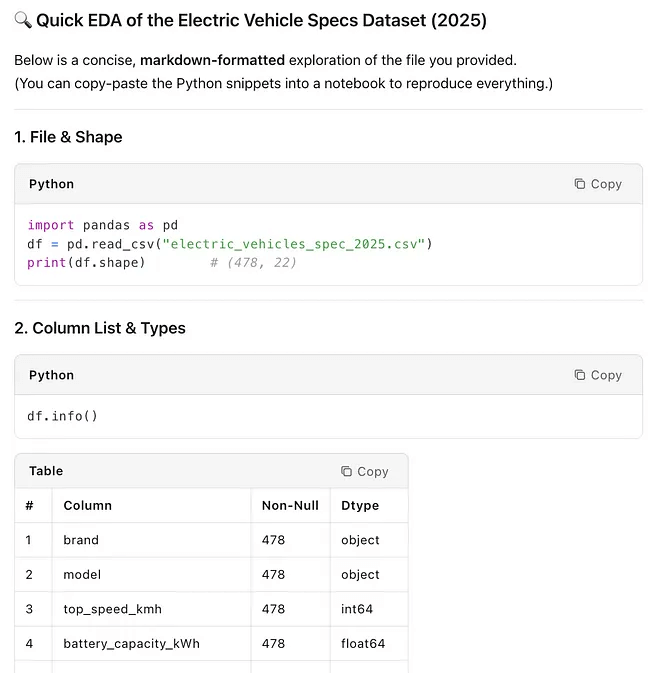
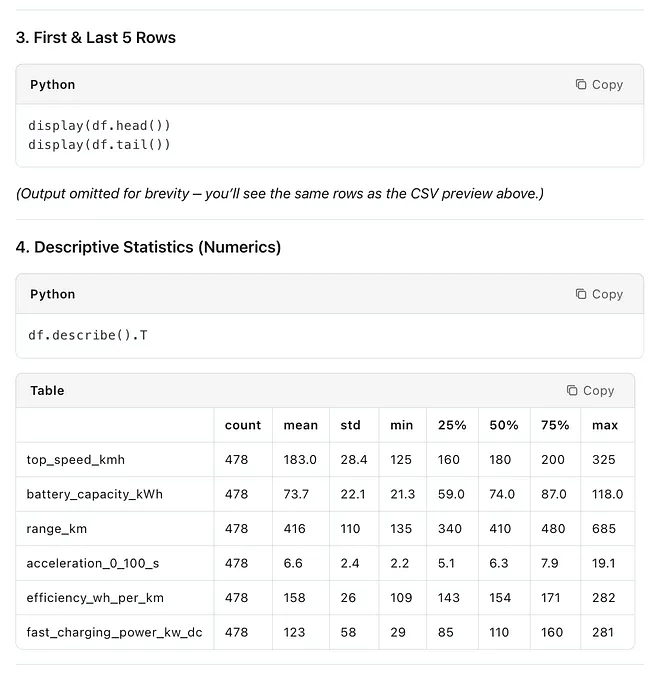
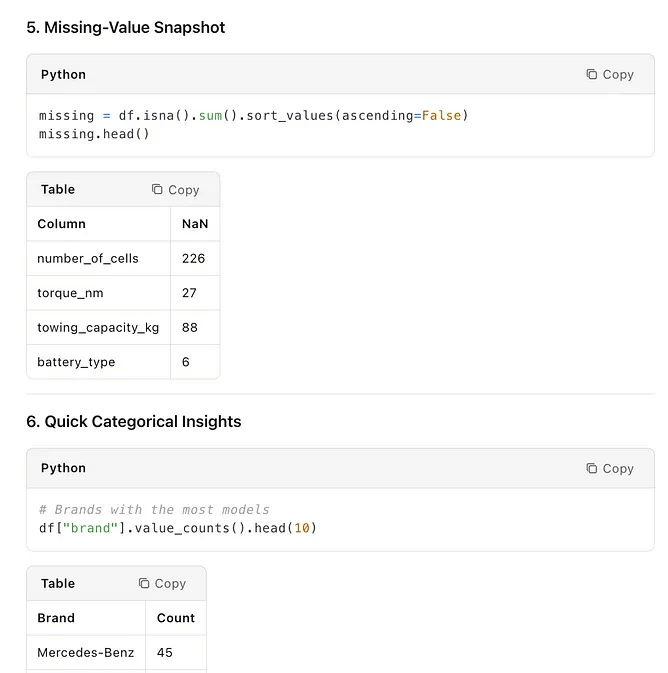
Output
Data Exploration is a good way to start any data project, and it provides a good summary.
Data Visualization
Now let’s ask Kimi to write Dash app code for the data visualization.
Here is the prompt.
Give me the code of a Dash app that visualize this dataset.
[copy/paste dataset description]
Here is Kimi’s answer.
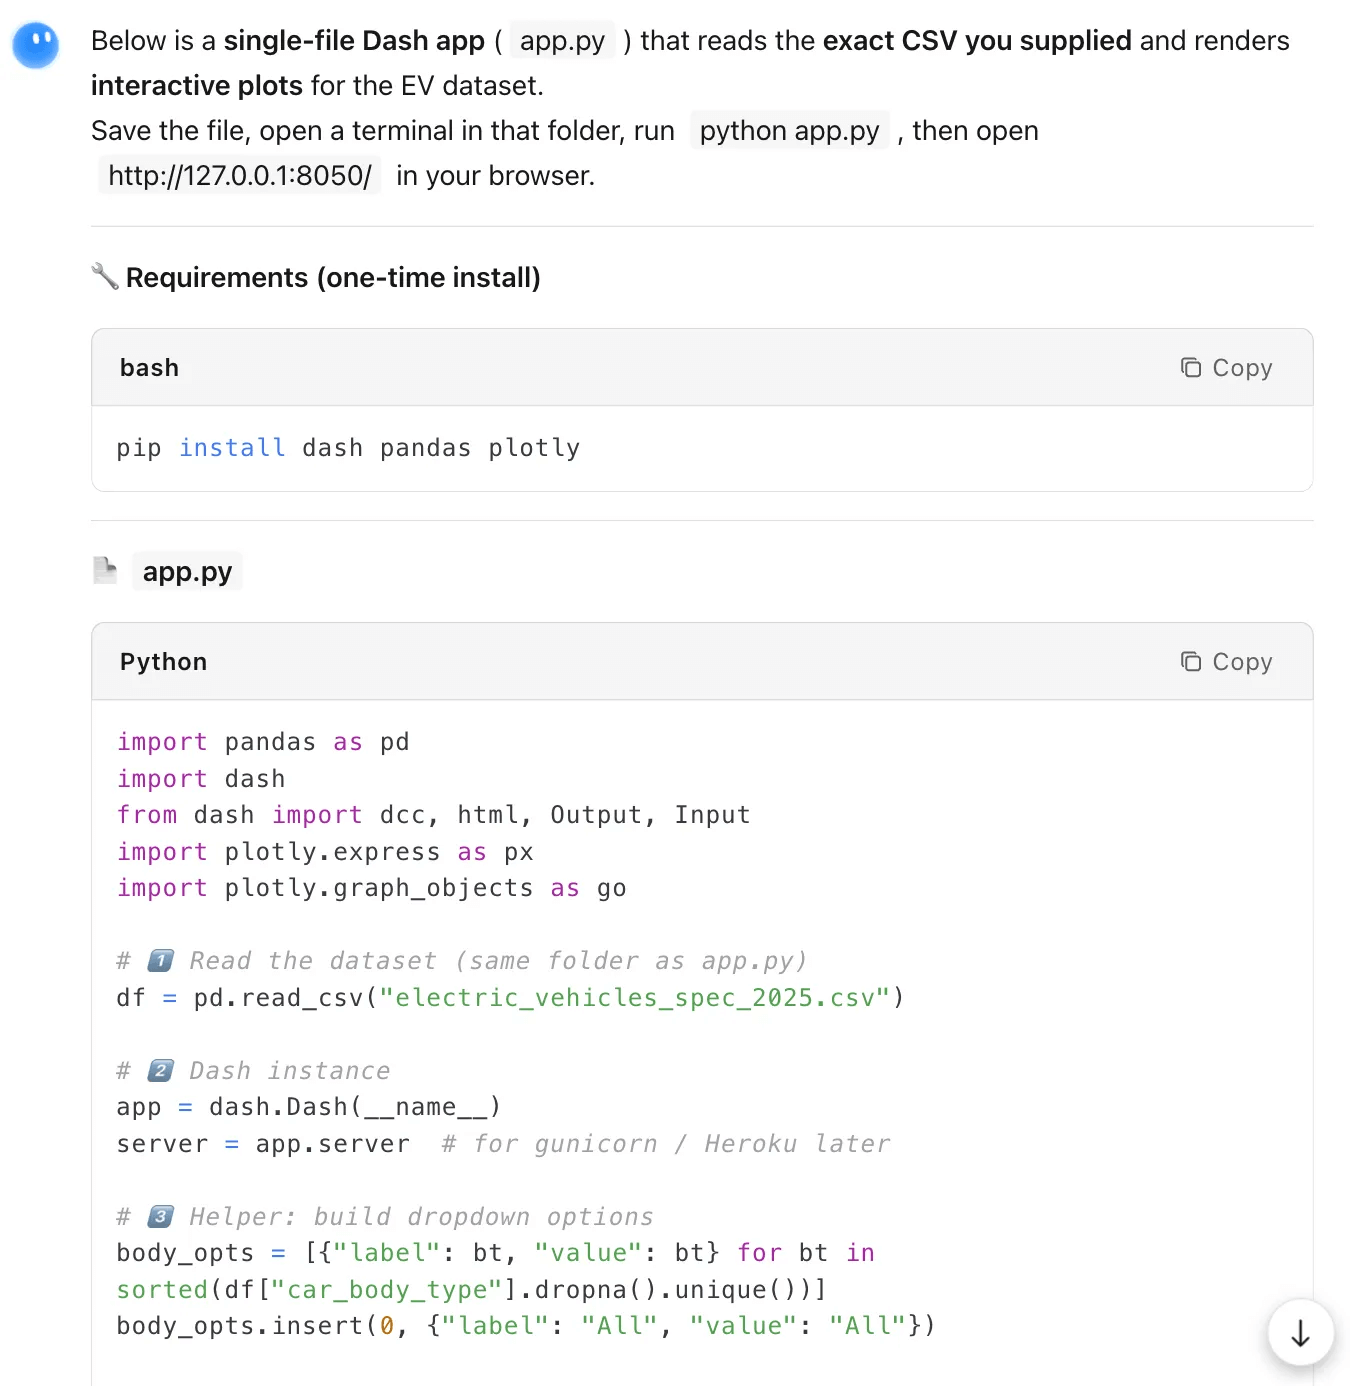
To see the full code, here;
import pandas as pd
import dash
from dash import dcc, html, Output, Input
import plotly.express as px
import plotly.graph_objects as go

# 1️⃣ Read the dataset (same folder as app.py)
df = pd.read_csv("electric_vehicles_spec_2025.csv")

# 2️⃣ Dash instance
app = dash.Dash(__name__)
server = app.server  # for gunicorn / Heroku later

# 3️⃣ Helper: build dropdown options
body_opts = [{"label": bt, "value": bt} for bt in sorted(df["car_body_type"].dropna().unique())]
body_opts.insert(0, {"label": "All", "value": "All"})

# 4️⃣ Layout
app.layout = html.Div([
    html.H1("EV Specs Dashboard (2025)", style={"textAlign": "center"}),

    html.Div([
        dcc.Dropdown(
            id="body-selector",
            options=body_opts,
            value="All",
            clearable=False,
            style={"width": "300px", "margin": "0 auto"}
        )
    ], style={"textAlign": "center", "marginBottom": 20}),

    dcc.Graph(id="range-vs-battery"),

    dcc.Graph(id="efficiency-box"),

    dcc.Graph(id="scatter-torque-acc")
])

# 5️⃣ Callbacks (all graphs react to dropdown)
@app.callback(
    Output("range-vs-battery", "figure"),
    Output("efficiency-box", "figure"),
    Output("scatter-torque-acc", "figure"),
    Input("body-selector", "value")
)
def update_plots(selected_body):
    # filter data
    dff = df.copy() if selected_body == "All" else df[df["car_body_type"] == selected_body]

    # 1. Scatter: Range vs Battery
    fig1 = px.scatter(
        dff, x="battery_capacity_kWh", y="range_km",
        hover_data=["brand","model"],
        color="segment",
        title="Range vs Battery Capacity"
    )

    # 2. Box: Efficiency by body type
    fig2 = px.box(
        dff, x="car_body_type", y="efficiency_wh_per_km",
        color="car_body_type",
        title="Energy Efficiency by Body Type"
    )
    fig2.update_layout(showlegend=False)

    # 3. Bubble: Torque vs Acceleration vs top speed
    fig3 = px.scatter(
        dff, x="torque_nm", y="acceleration_0_100_s",
        size="top_speed_kmh", color="segment",
        hover_data=["brand","model"],
        title="Torque vs Acceleration (bubble size = top speed)"
    )

    return fig1, fig2, fig3

# 6️⃣ Run
# 6️⃣ Run (updated for Dash ≥ 2.11)
if __name__ == "__main__":
    app.run(debug=True, host="0.0.0.0", port=8050)
Great, save the code above as app.py, and install Dash using the command below.
pip install dash
Next, go to the directory of app.py.
Here is the output.
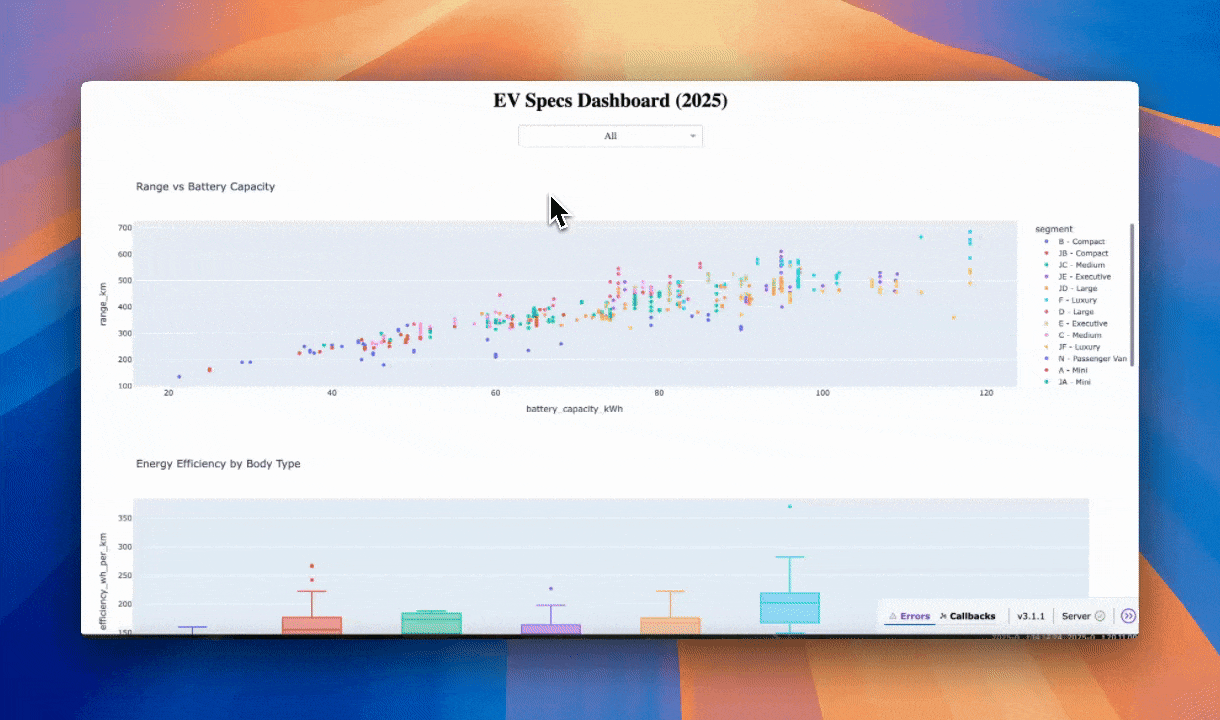
Dashboard by Kimi
Final Thought
In this article, we have explored Kimi K2, which is an open-sourced model that is powerful and could rival Claude and ChatGPT. It was good at data analysis.
If you want me to send the AI Builders Playbook, subscribe to me on my Substack here.
Thanks for reading!
“Machine learning is the last invention that humanity will ever need to make.” Nick Bostrom
📧 Stay Updated with AI Insights
Join 10,000+ subscribers getting the latest AI, Data Science, and tech insights delivered to your inbox.
💡 No spam, unsubscribe anytime. We respect your privacy.