
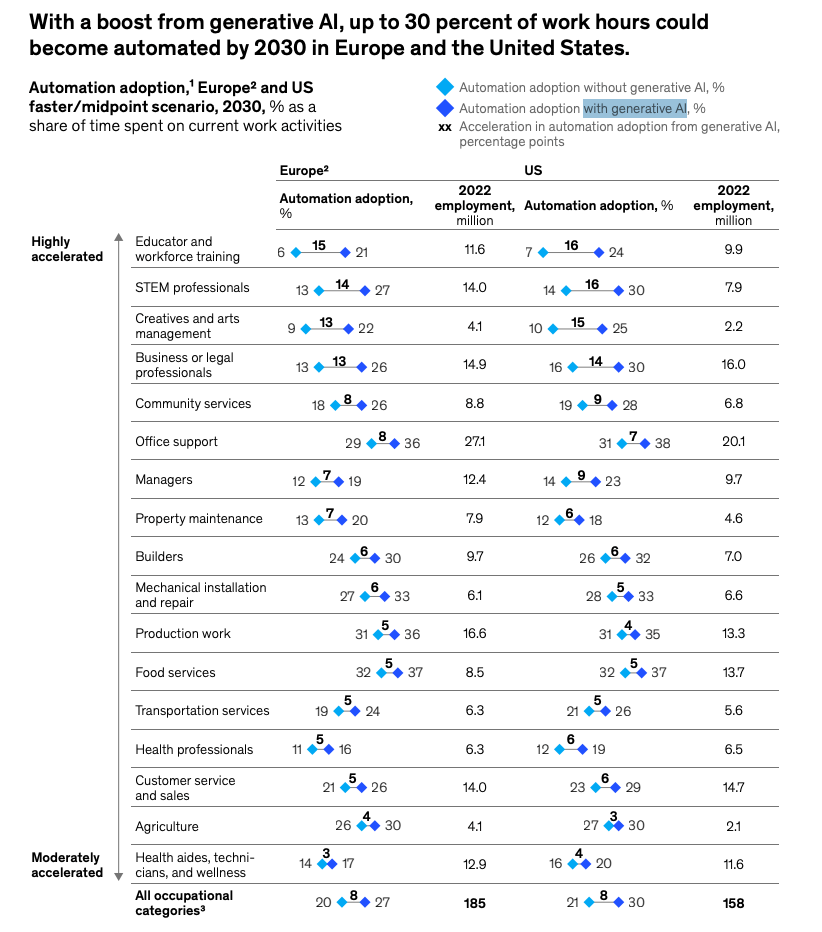
A recent McKinsey report indicates that up to 30% of hours worked today could be automated by 2030.
This is a clear message: manual coding will no longer be the first choice.
That’s why, in this article, we will explore ManusAI, which is poised to be the next big thing in data analysis and data visualization.
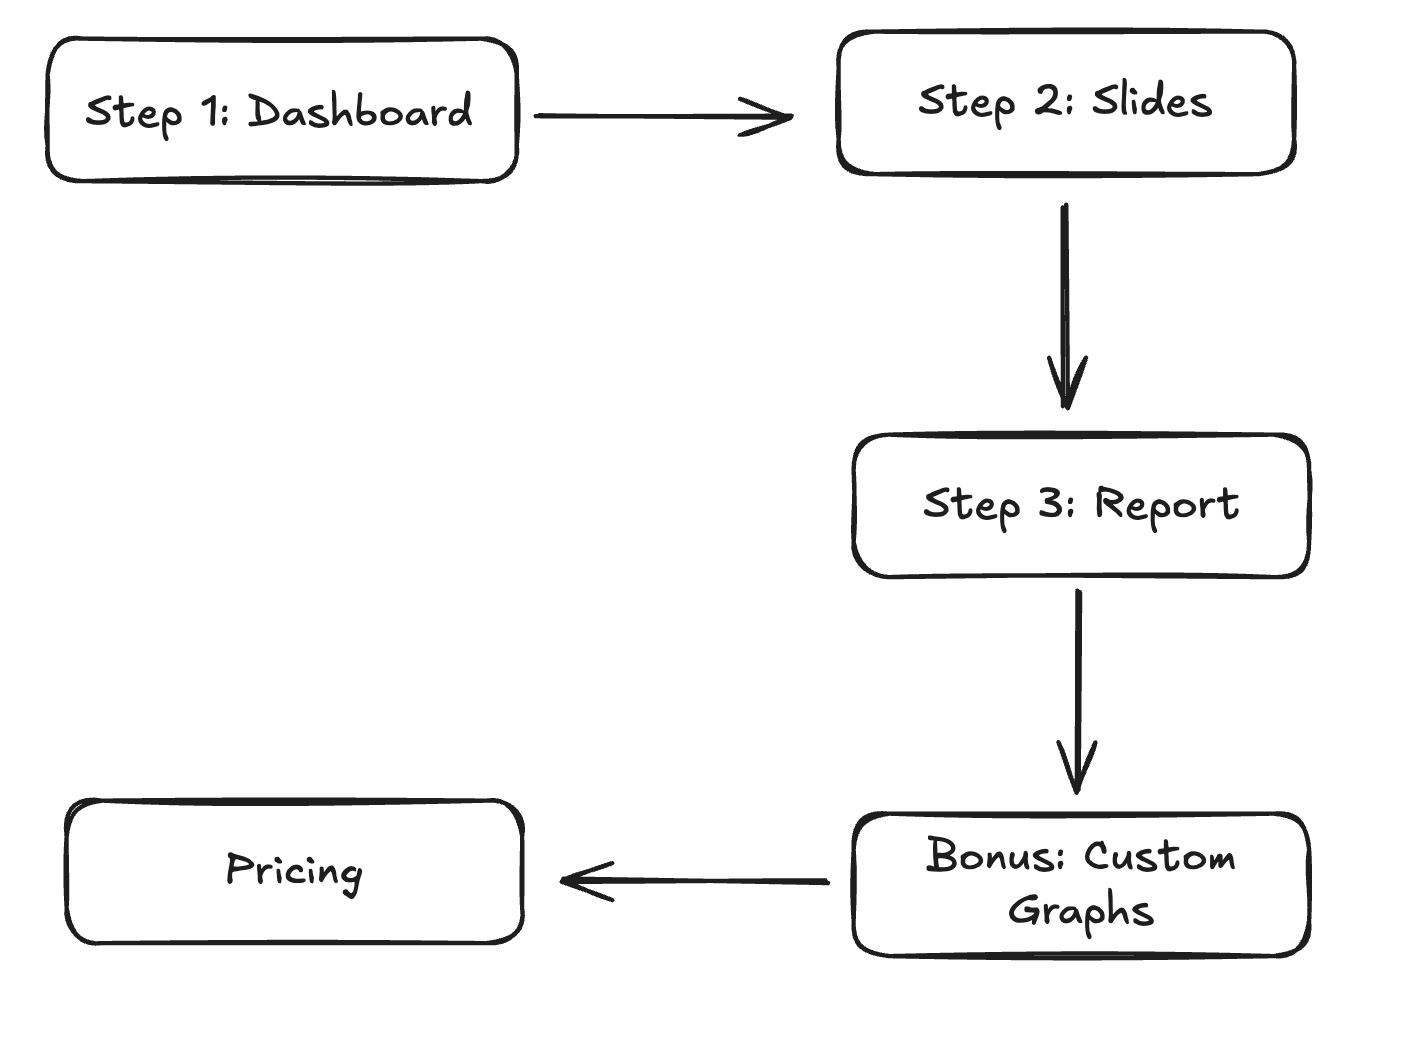
This can be your go-to tool in Data Science, making you forget about other tools like ChatGPT or Excel! Here are the steps we will follow in the screenshot below.
Manus AI: Data Visualization Automation
Dashboards
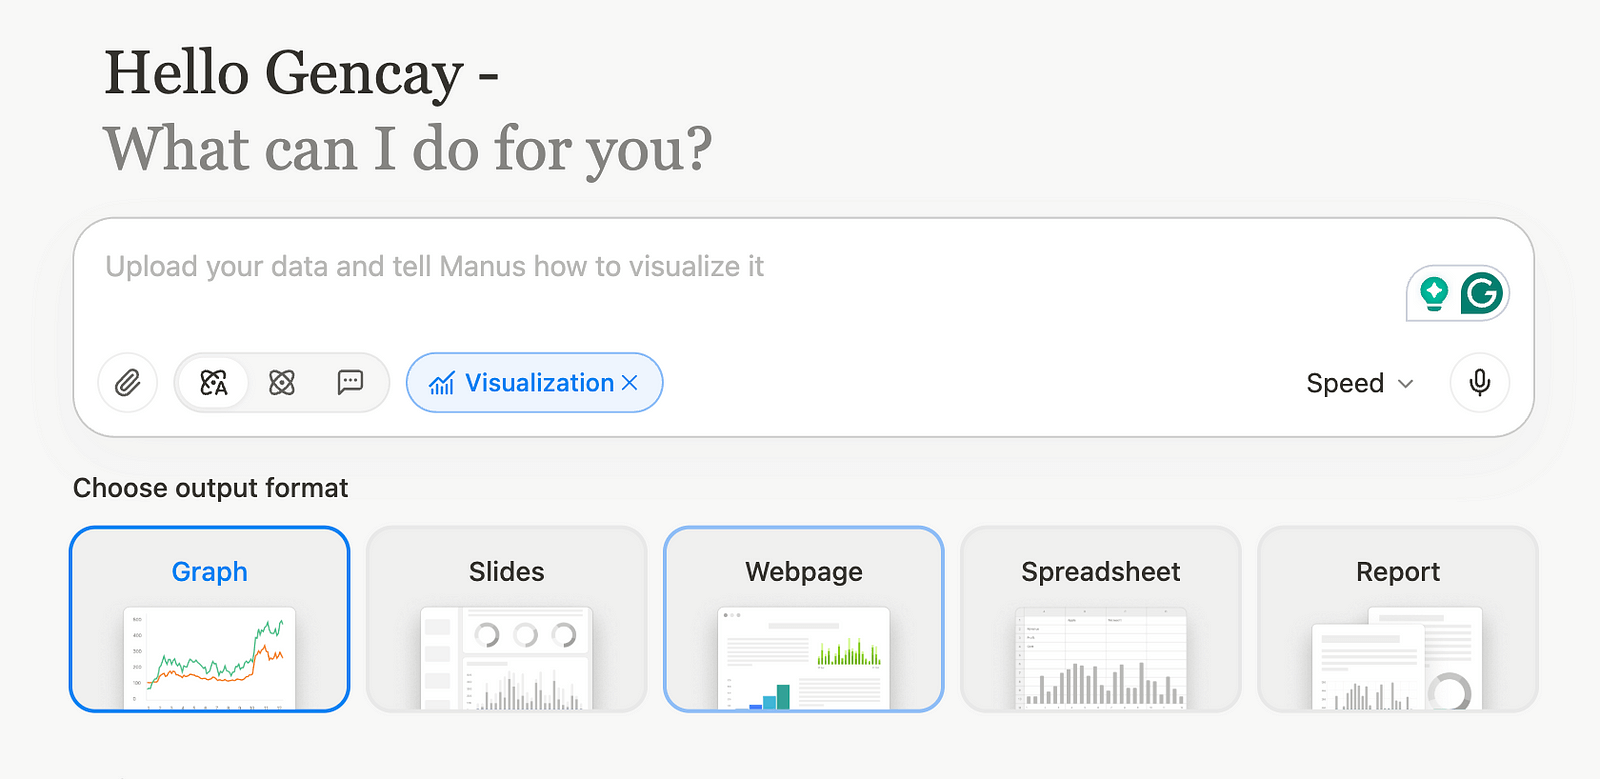
Manus AI: Graph
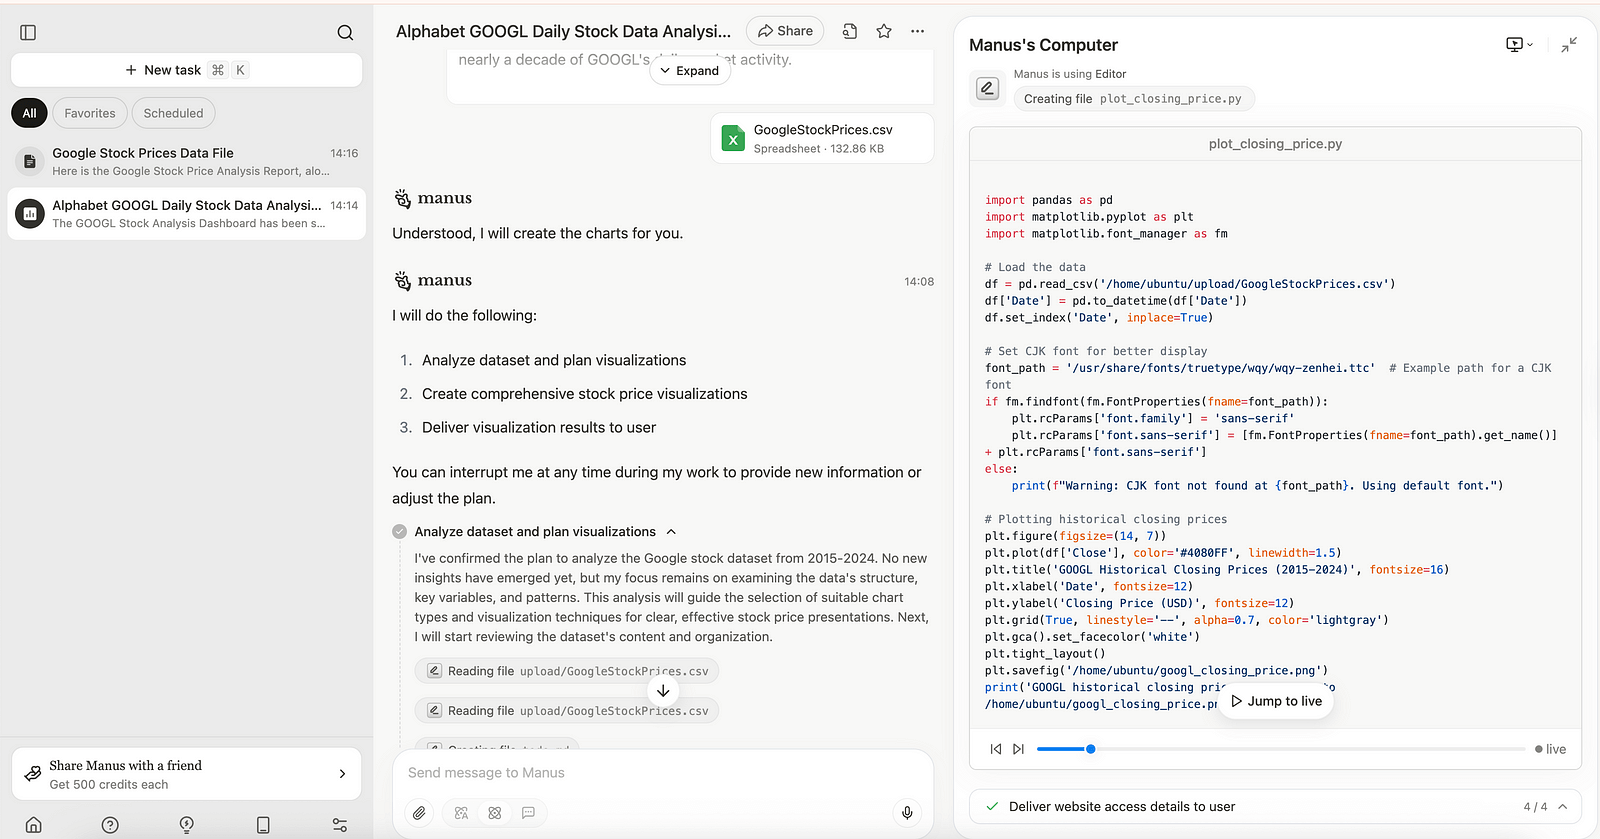
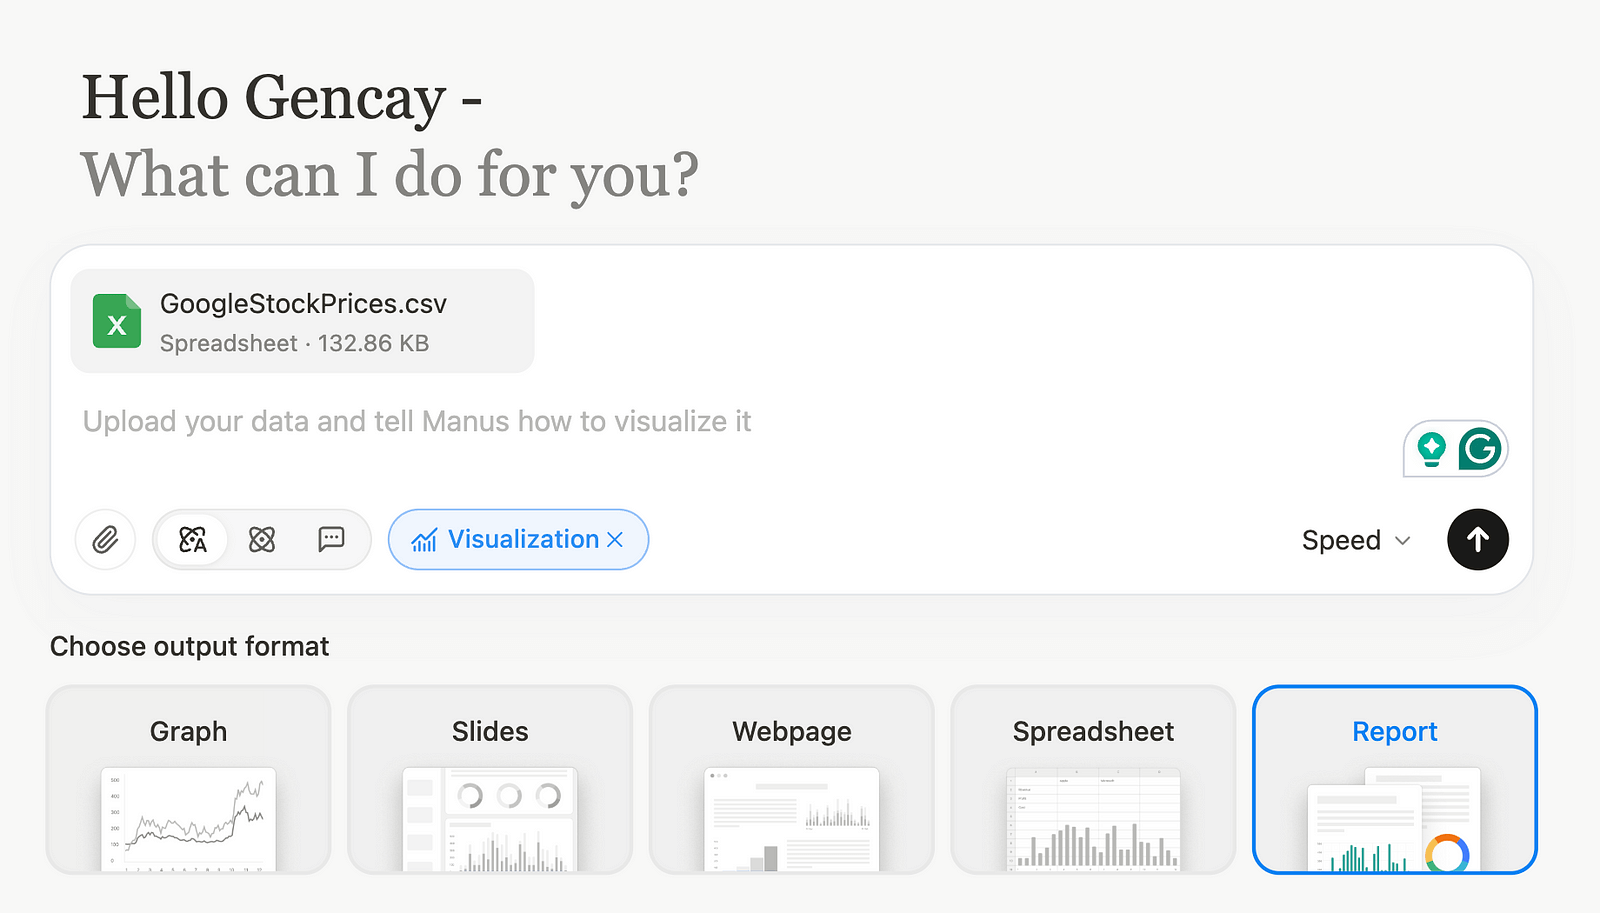
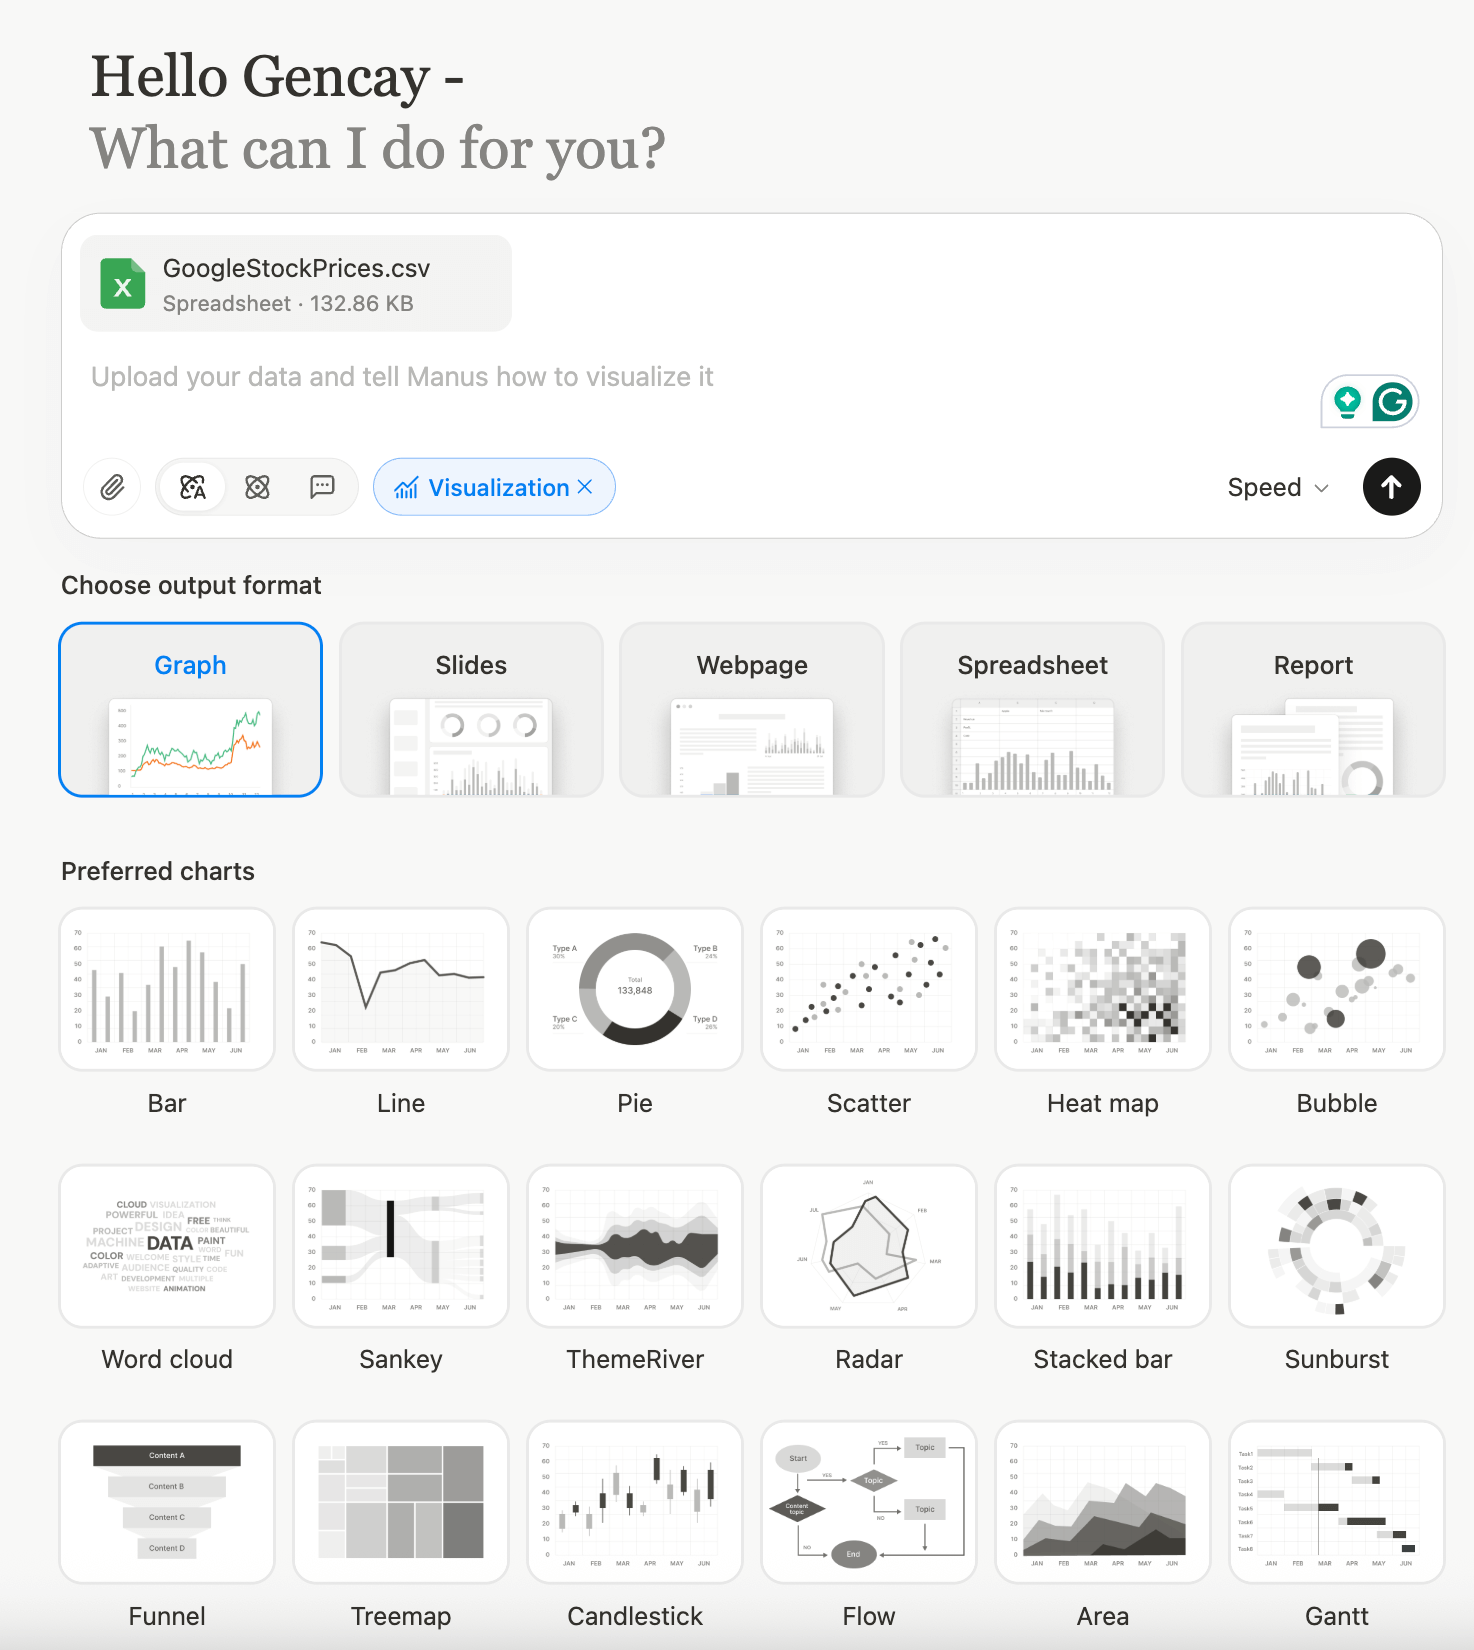
Let’s start step by step, upload your dataset, and tell Manus how to visualize it.
In this case, we’ve selected the “Graph” format to explore the Google stock dataset.
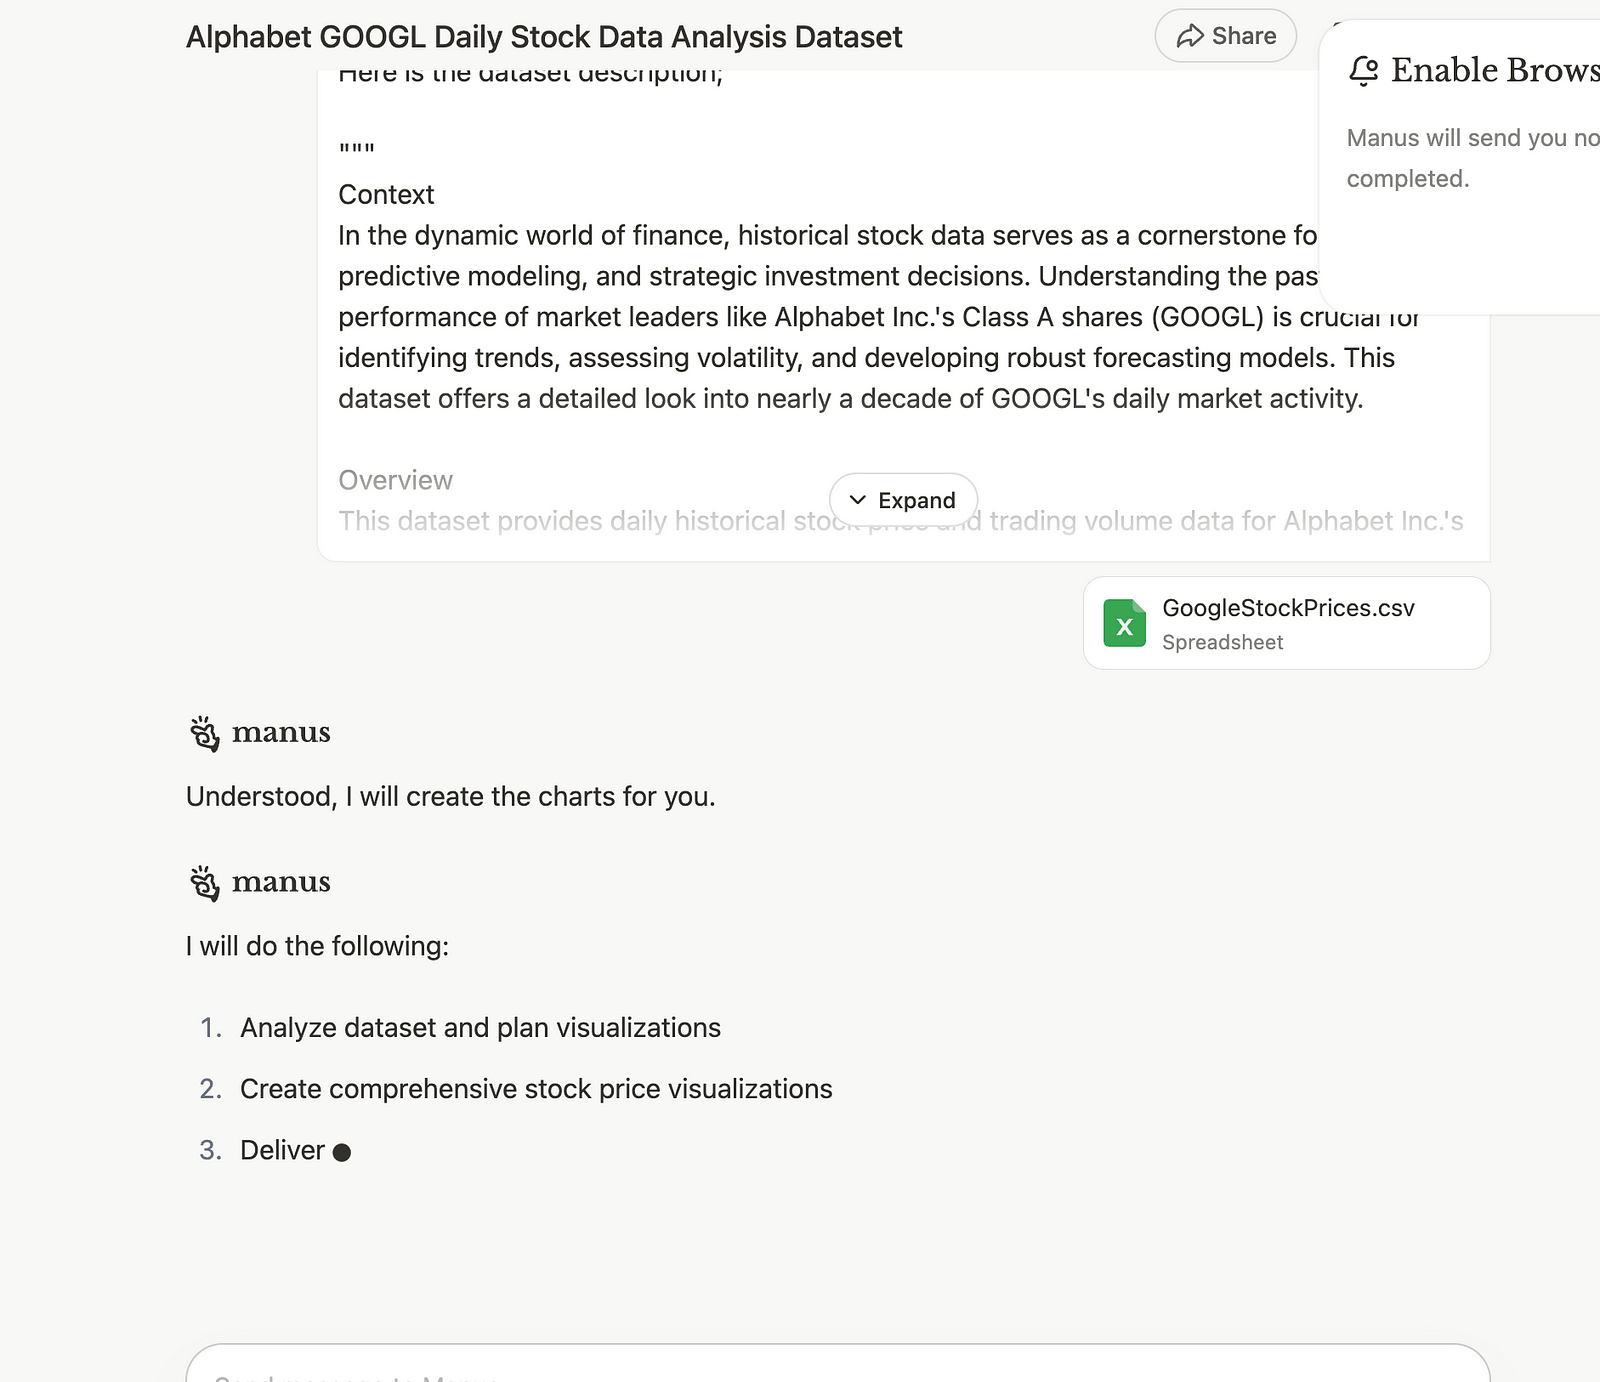
Manus Task List
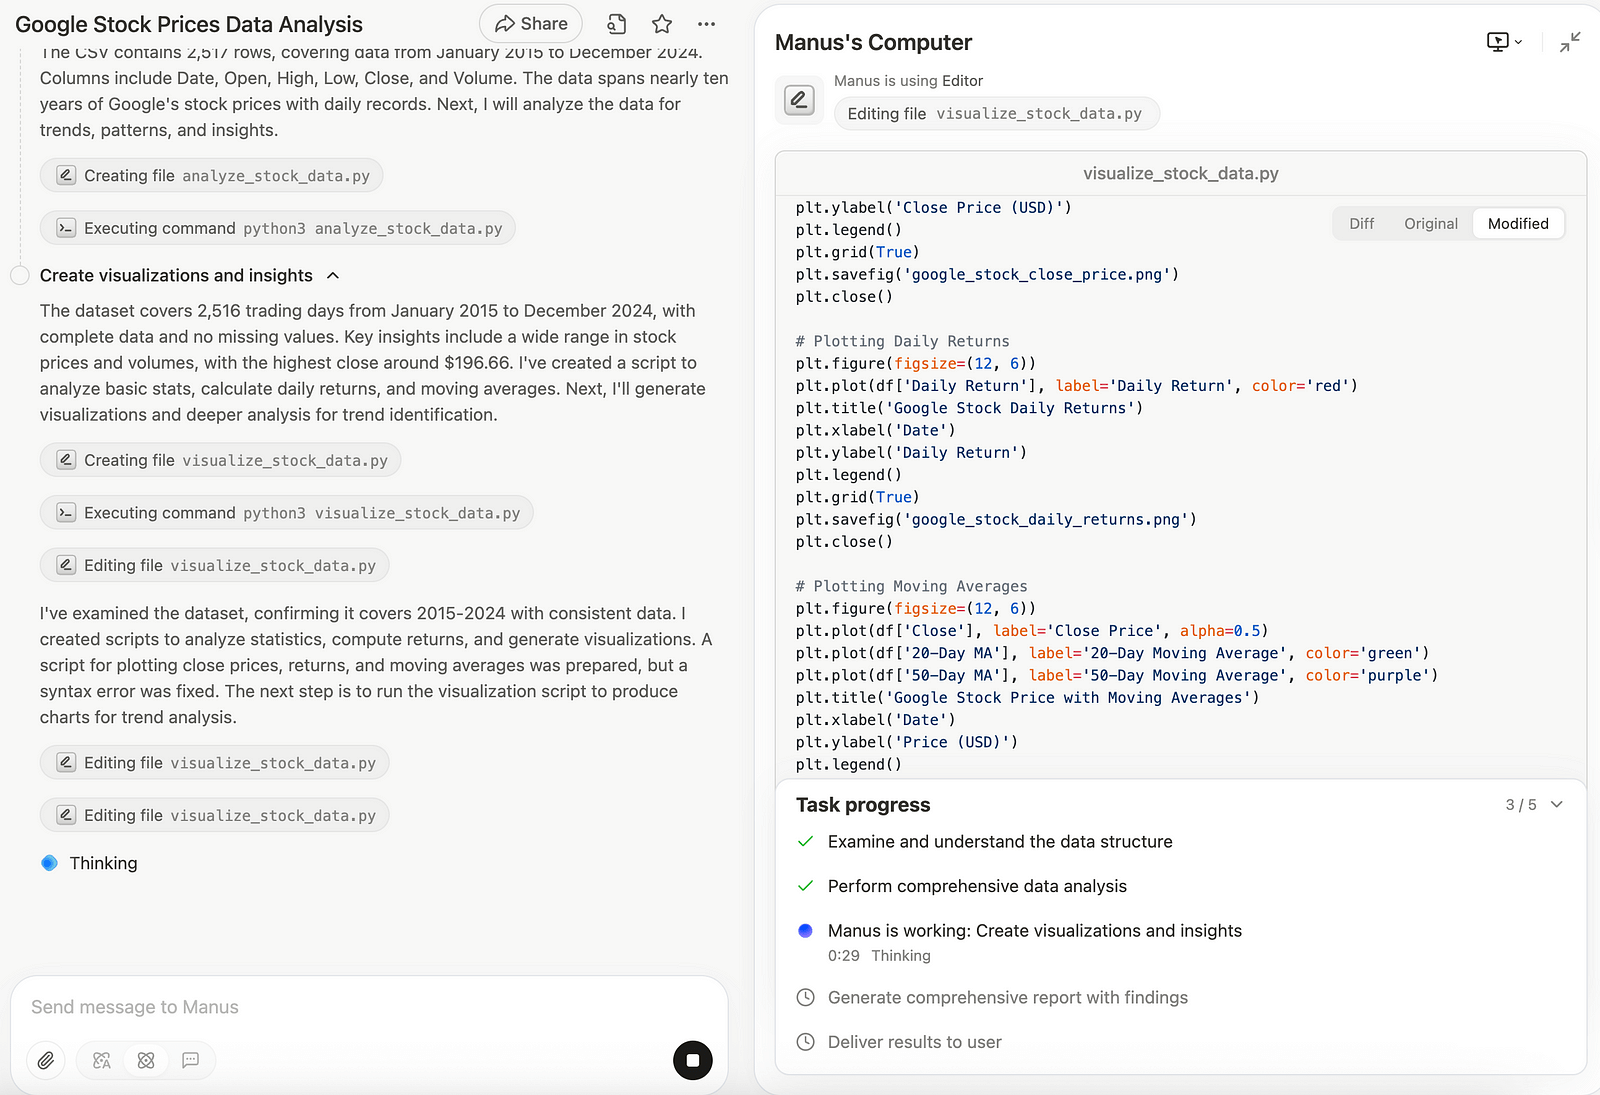
Once you attach the dataset and confirm the visualization request, Manus gets to work.
As you can see on the right, its internal AI computer begins working on the data and generating the code on its own.
Manus Full Screen
It analyzes the dataset, writes the script, and generates visuals, and you are the co-pilot, doing nothing but watching.
Once the charts are ready, Manus presents them visually.
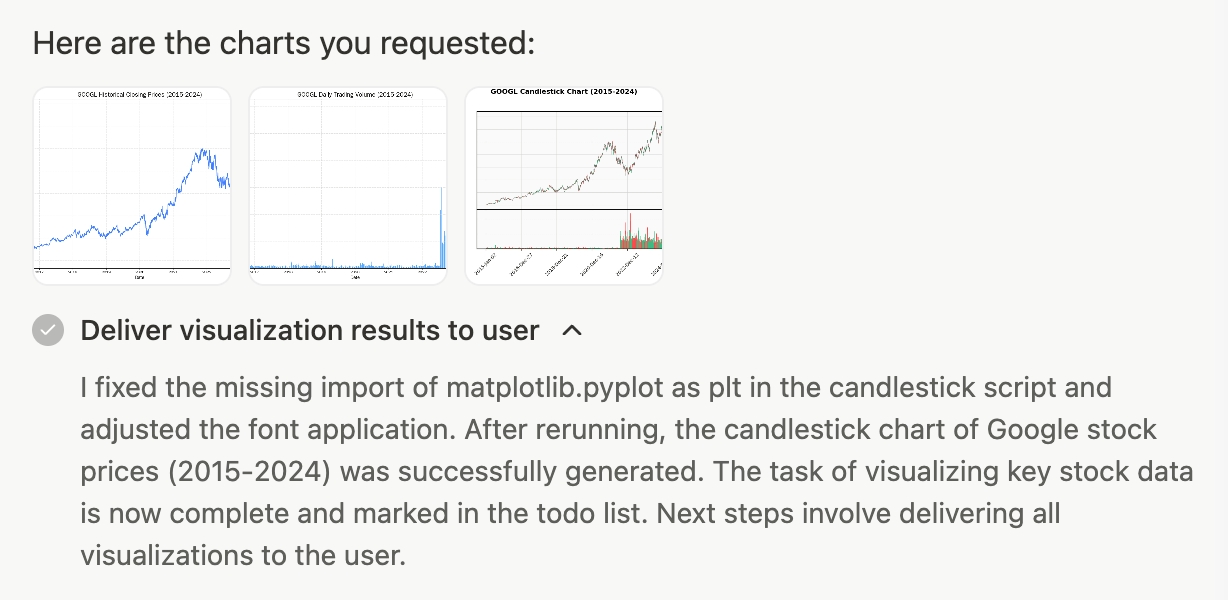
ManusAI finished creating Graphs.
Here is one of these graphs;
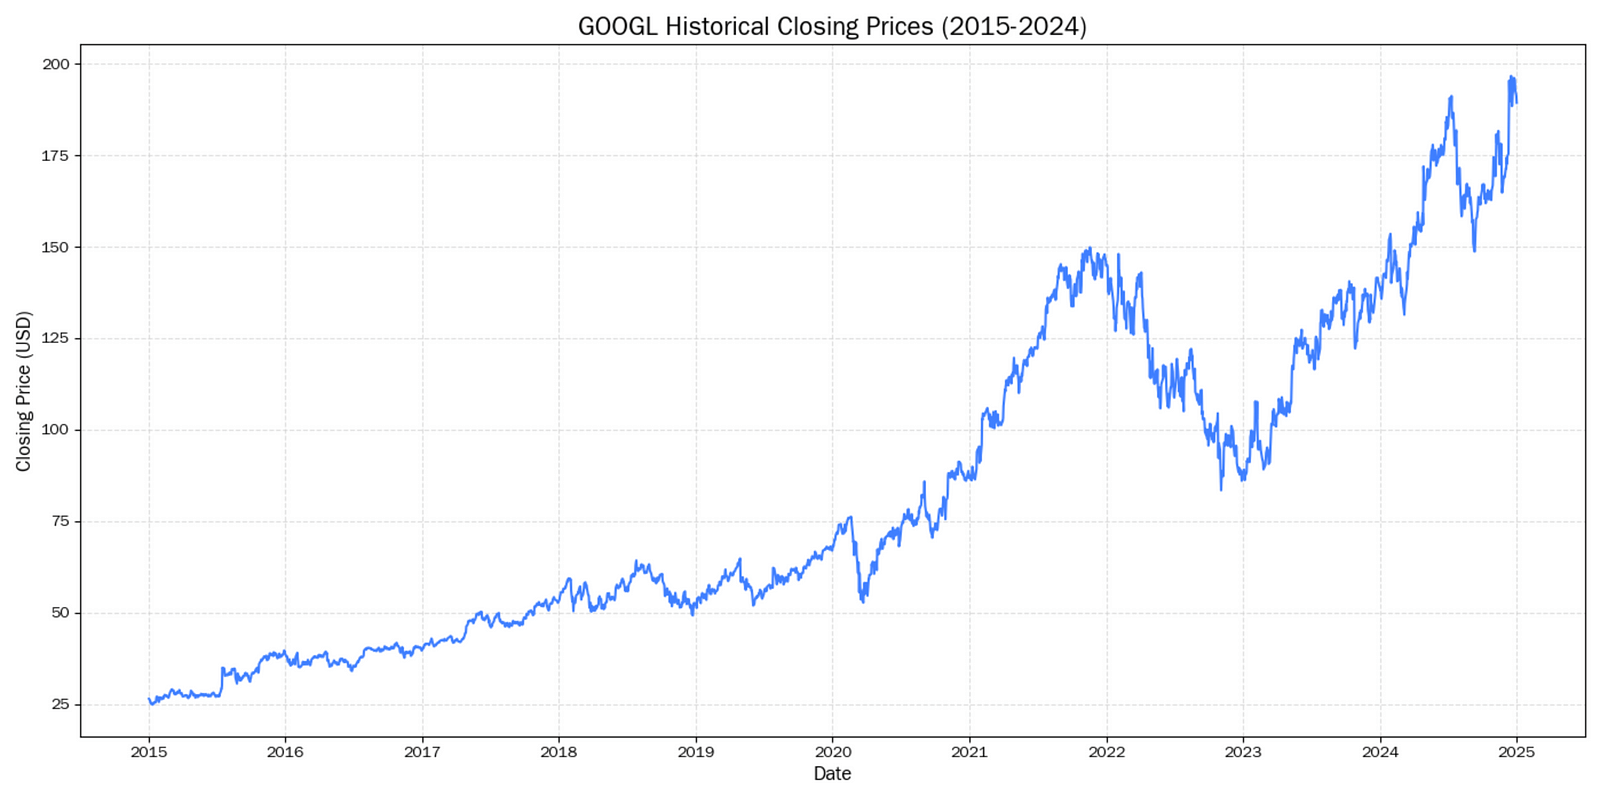
Graph 1: Created with Manus AI
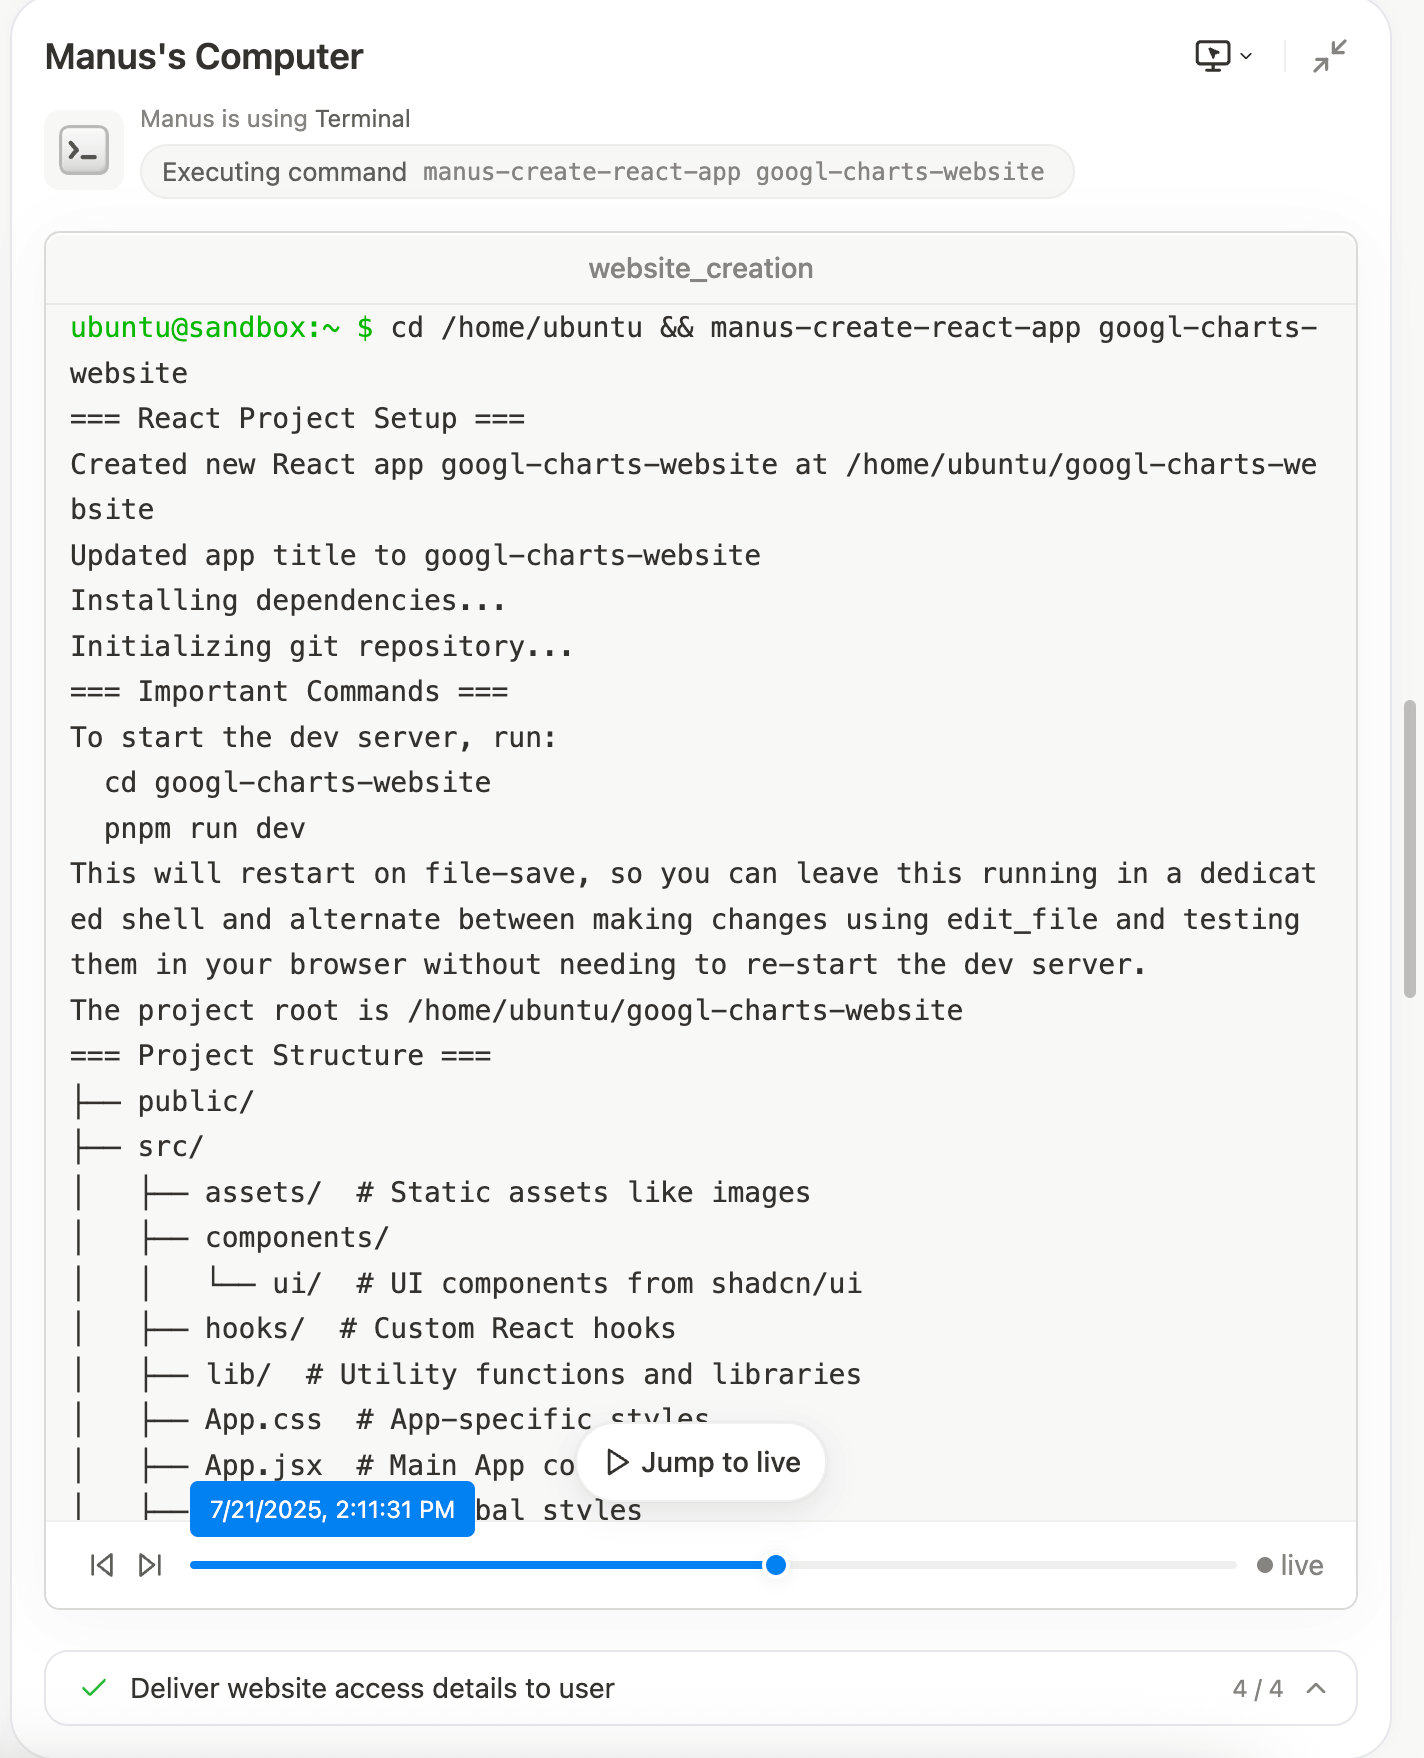
Then, Manus goes one step further. It offers to build a website out of your visualizations.
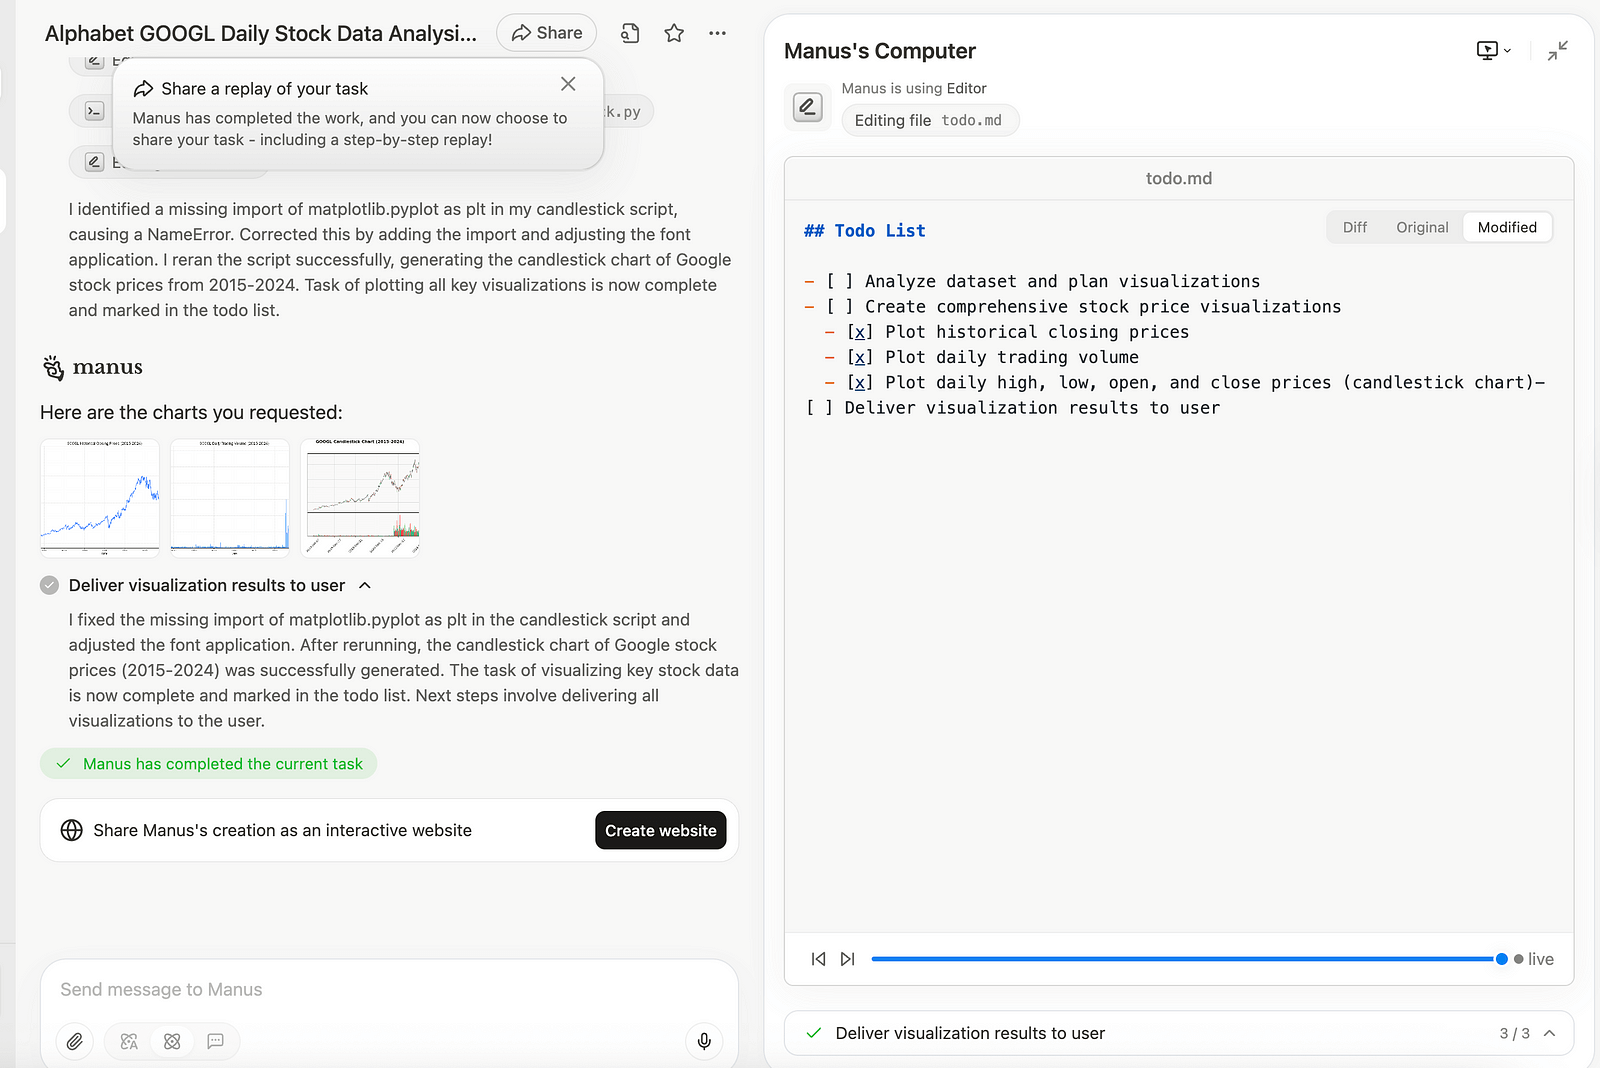
The code is running on Manus’s Computer.
Once you click confirm, the result is a live dashboard, published online in seconds.
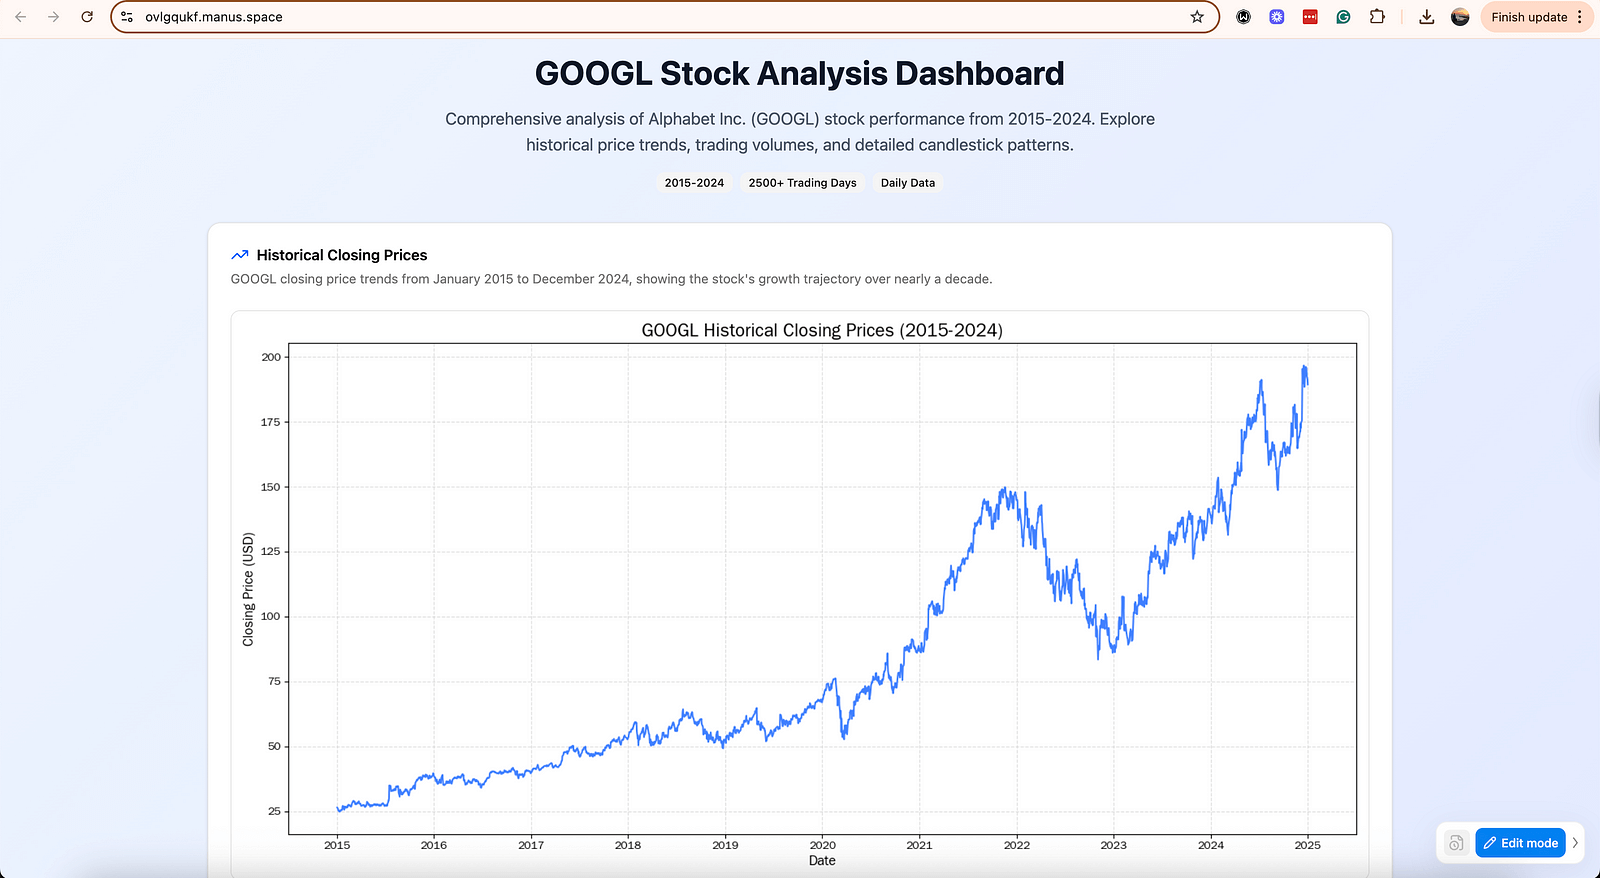
The website is ready for free!
You can track progress, access the full code, and even replay the steps if needed. Everything happens in minutes, not hours.
Track Progress on ManusAI
Slides
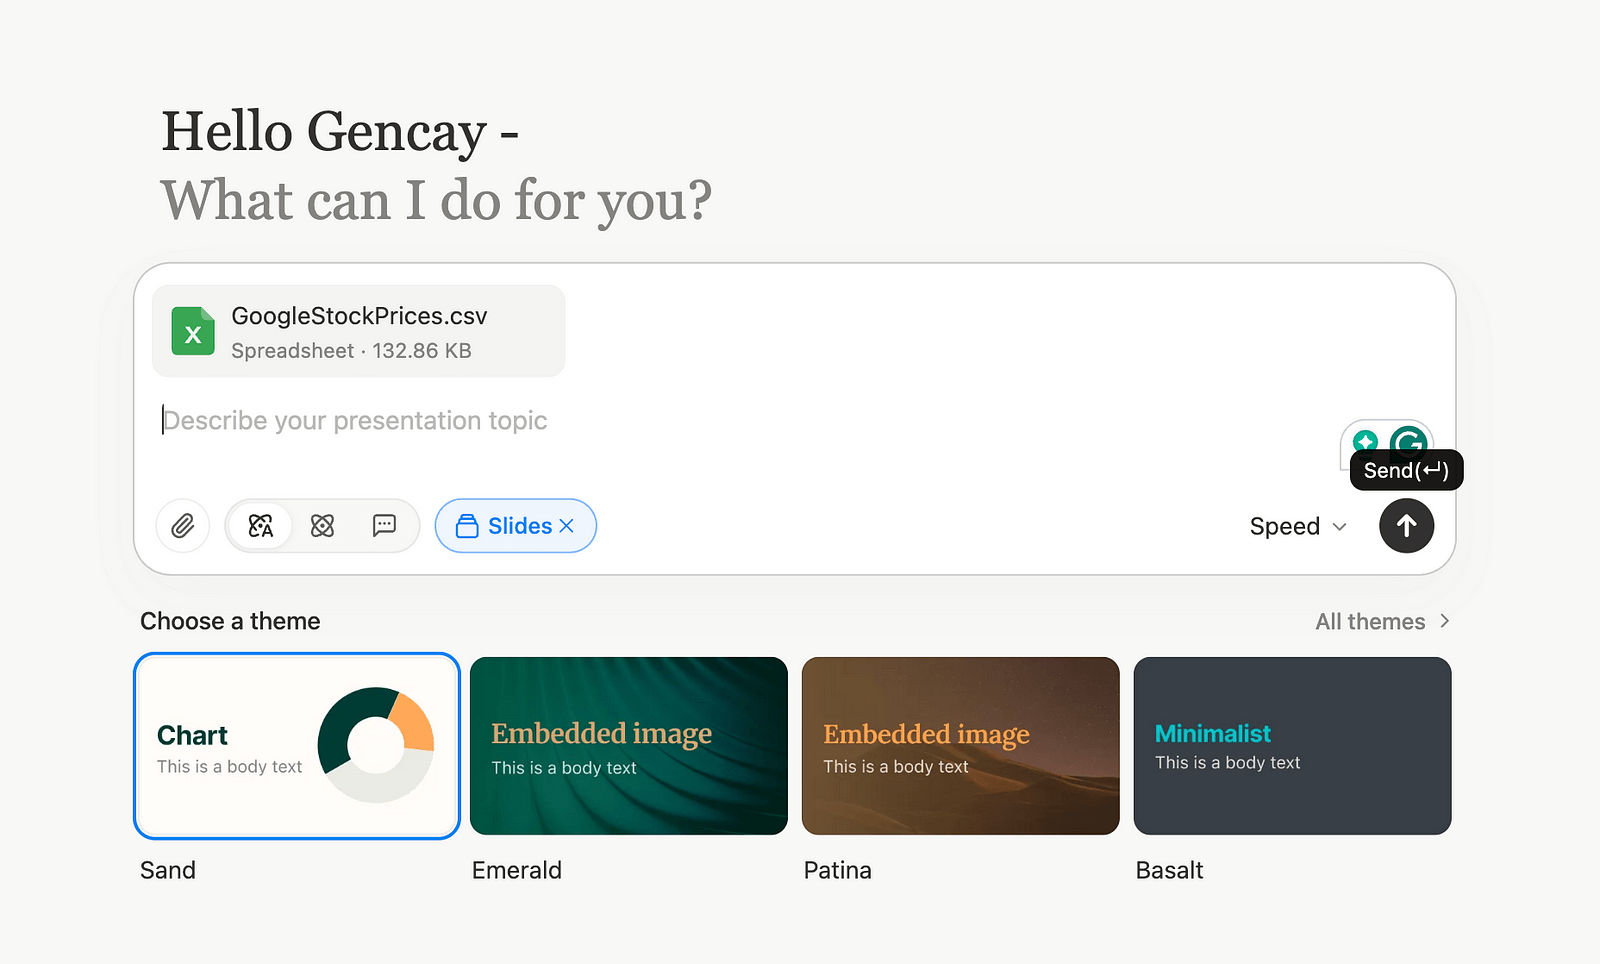
Manus AI: Slides
Let’s create a slide.
After selecting the format, Manus asks you to pick a theme and chart style. You can go with any, but for this case, I chose the simplest chart option.
Then, voila!
Report
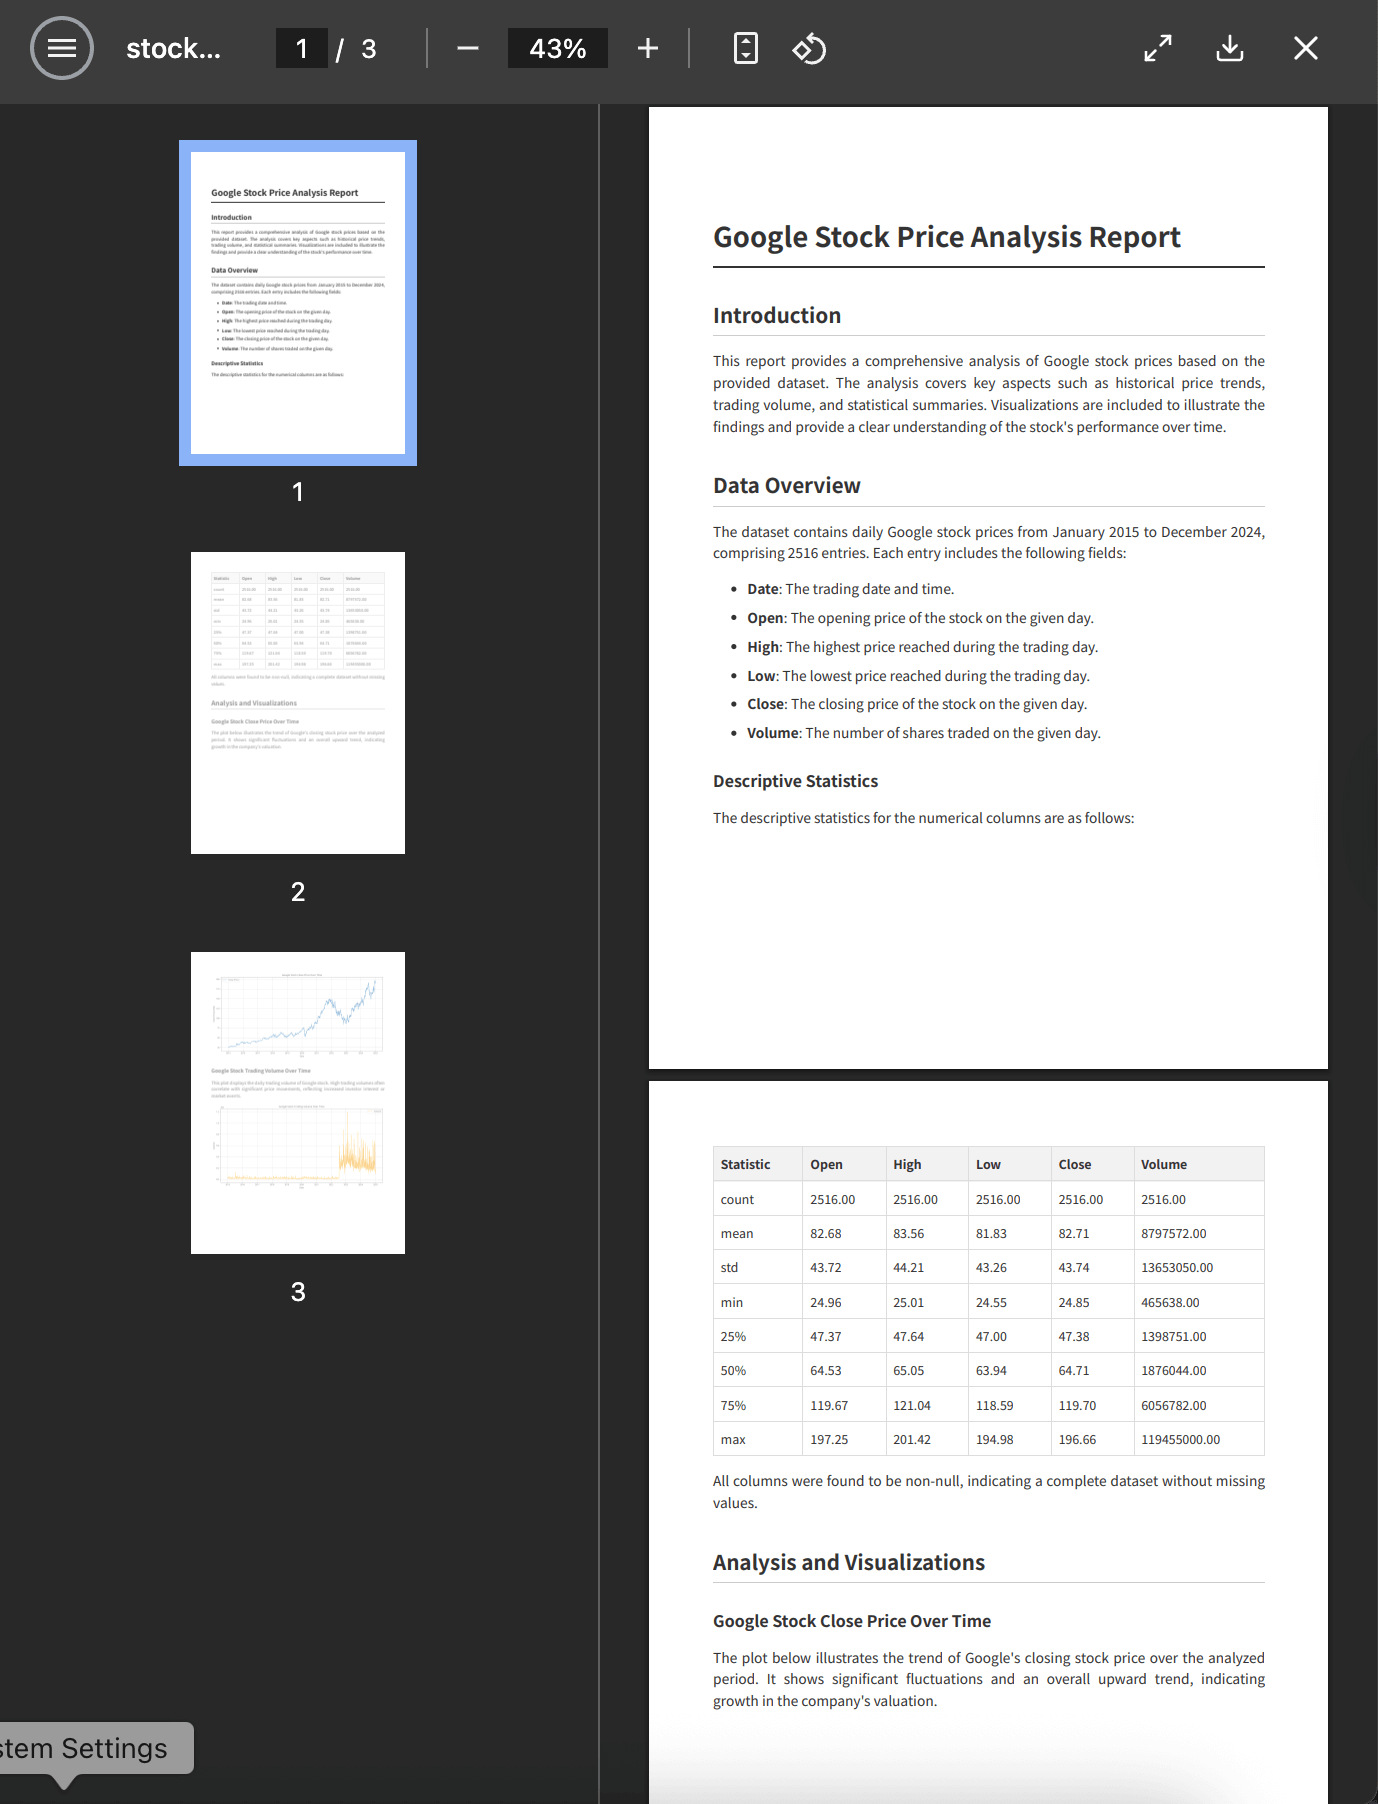
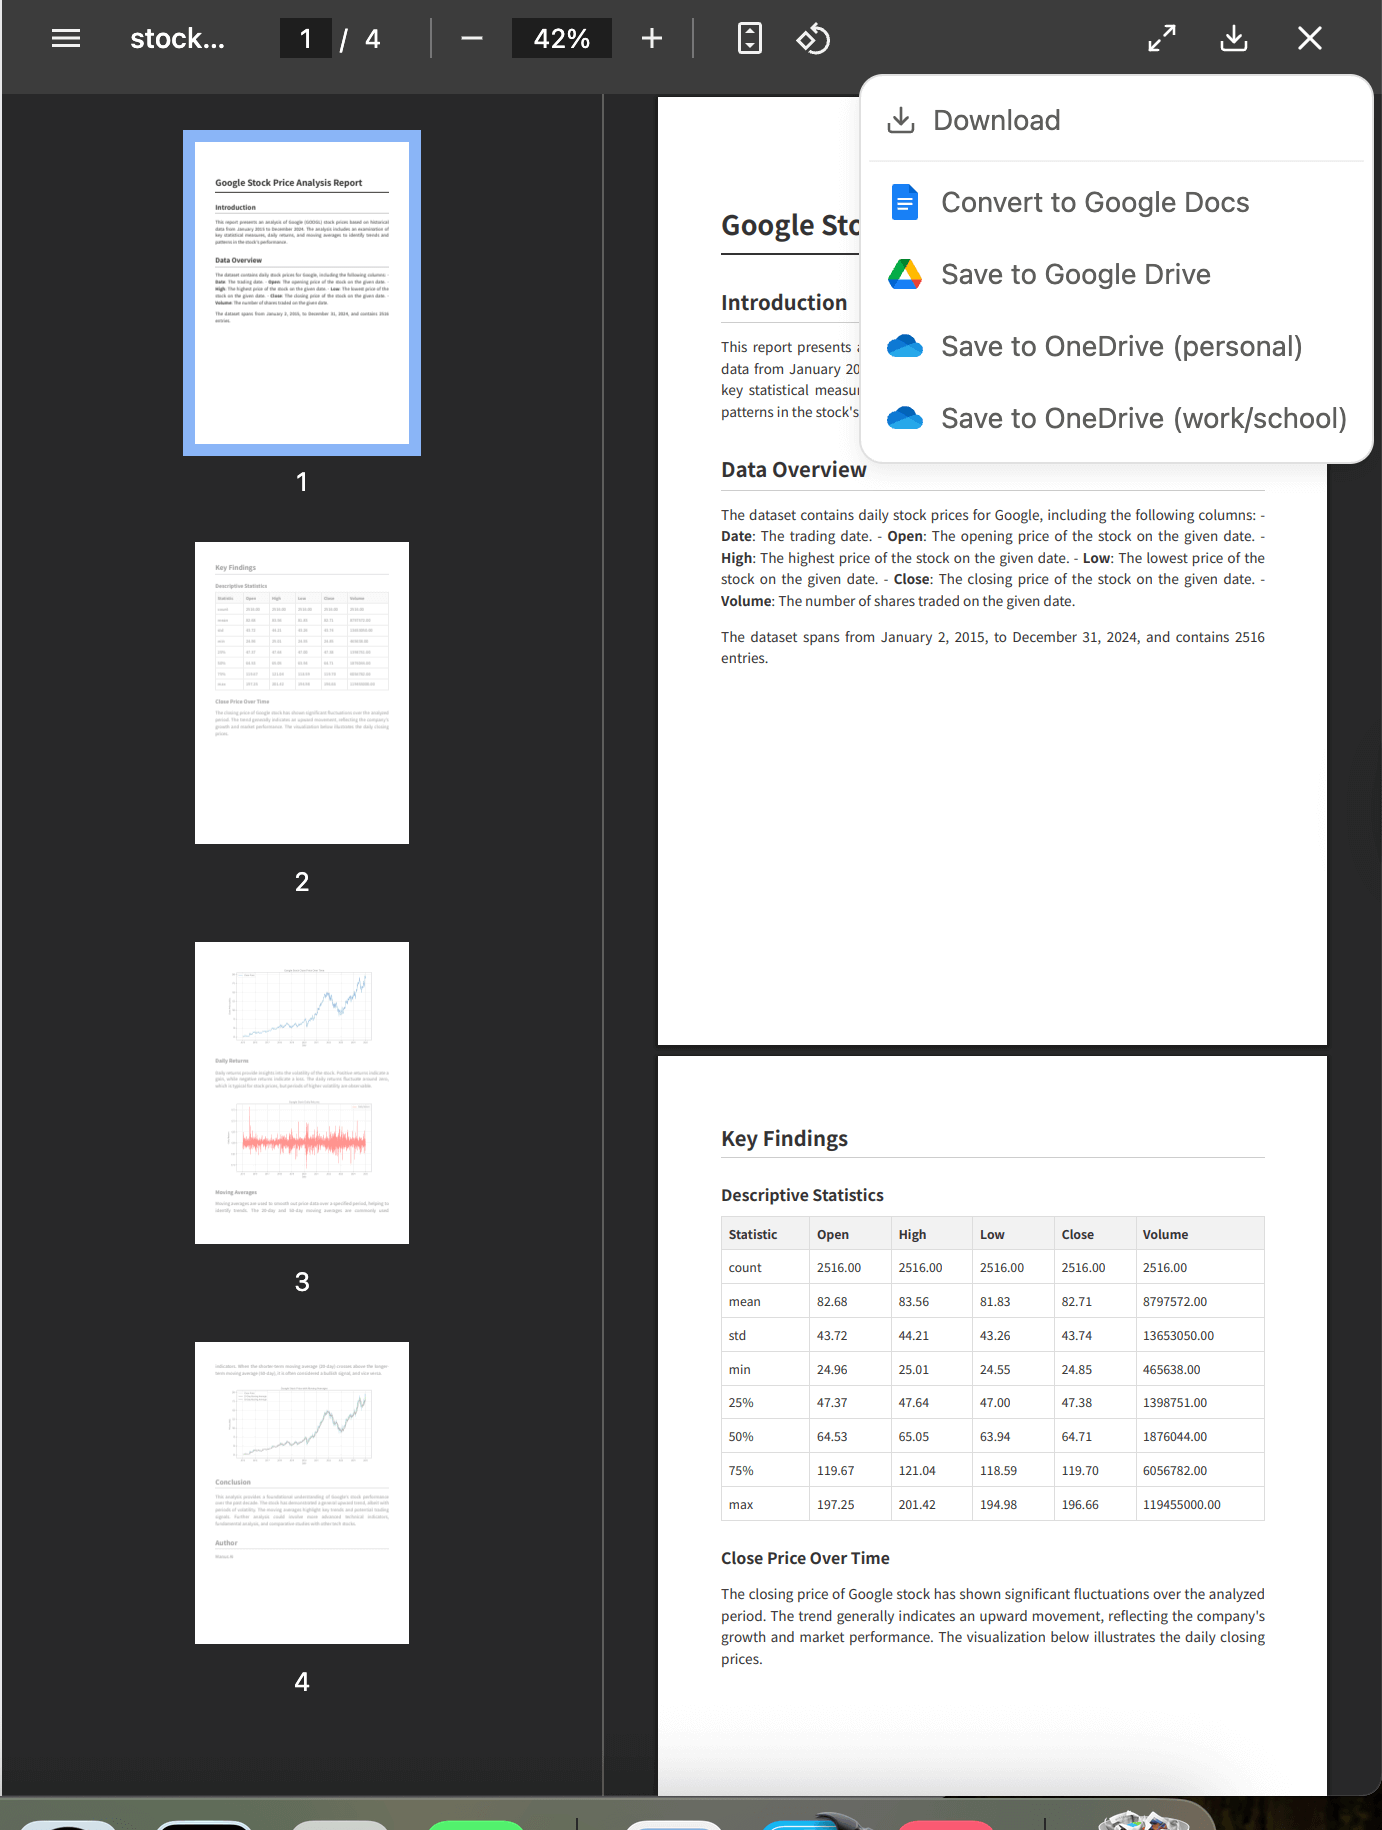
The results include a data overview, descriptive statistics analysis, and visualizations.
Report
ManusAI- Report
Next, let’s create a full report.
Select “Report” from the output options and upload your data. Manus begins processing the file and building the content, as shown in the screenshot below.
Initializing the computer
You can track progress in real-time.
Report creation
Here is the report. You can also convert it to Google Docs, save to Google Drive, or OneDrive.
Custom Graphs
Custom Graphs- Manus AI
If you have a specific graph in mind and need full control, you can select the preferred graph from the list above.
Bar, Line, Pie, Scatter, Heat Map, Bubble Chart, everything is here.
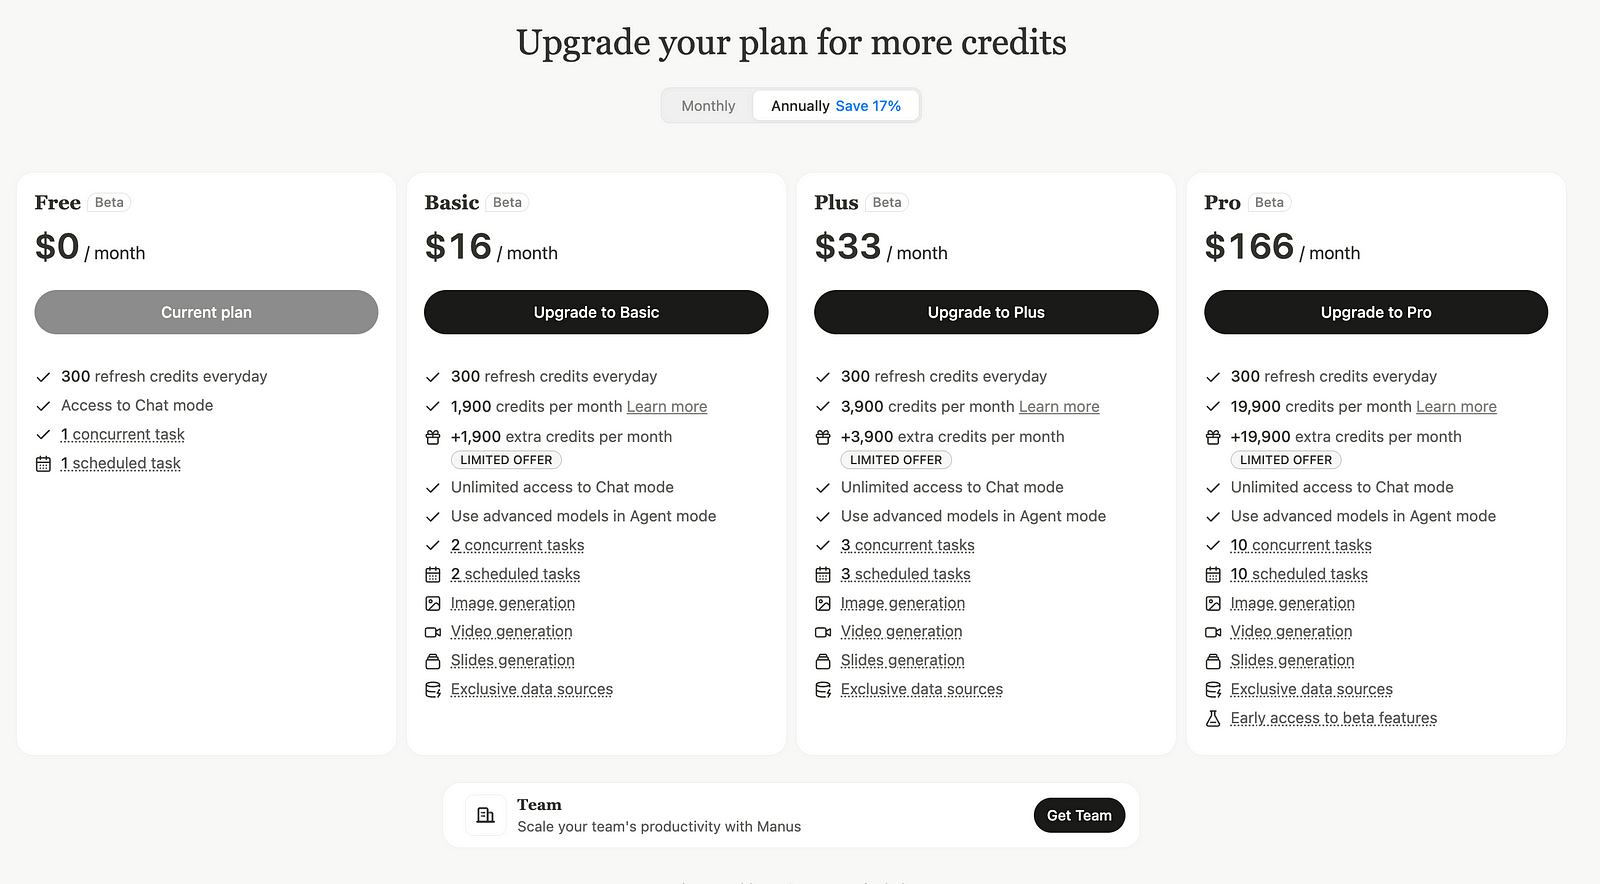
Pricing
Pricing: Manus IA
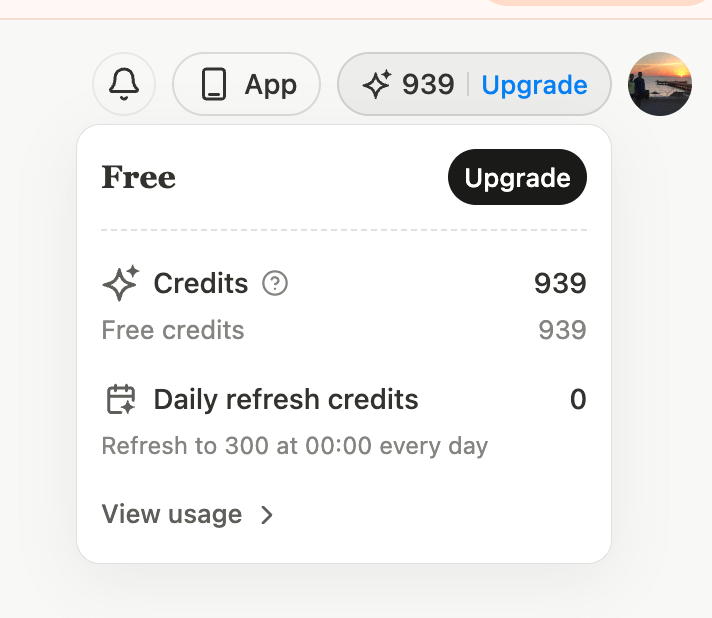
All the tasks above cost only 300 credits, and each user gets 300 tokens refreshed daily. If you have a subscription to their plans, there are more features. Please check the screenshot below.
Final Thoughts
In this article, we have explored three different use cases: creating a portfolio website, a dashboard, and a website that will turn you into a content machine.
You will then see the next steps, which allow you to publish those apps for free. Thanks for reading this one.
To discover similar no-code AI tools, check out our Substack. If you’re going to use some of those no-code AI tools like agents or assistants, visit our platform!
Here are the free resources.
Here is the ChatGPT cheat sheet.
Here is the Prompt Techniques cheat sheet.
Here is my NumPy cheat sheet.
Here is the source code of the “How to be a Billionaire” data project.
Here is the source code of the “Classification Task with 6 Different Algorithms using Python” data project.
Here is the source code of the “Decision Tree in Energy Efficiency Analysis” data project.
Here is the source code of the “DataDrivenInvestor 2022 Articles Analysis” data project.
“Machine learning is the last invention that humanity will ever need to make.” Nick Bostrom
Here are paid resources.
Here you can create your start-up ideas.
Here is our Substack page.
📧 Stay Updated with AI Insights
Join 10,000+ subscribers getting the latest AI, Data Science, and tech insights delivered to your inbox.
💡 No spam, unsubscribe anytime. We respect your privacy.